Unlock a world of possibilities! Login now and discover the exclusive benefits awaiting you.

- Qlik Community
- :
- All Forums
- :
- QlikView
- :
- Re: YTD calculations
- Subscribe to RSS Feed
- Mark Topic as New
- Mark Topic as Read
- Float this Topic for Current User
- Bookmark
- Subscribe
- Mute
- Printer Friendly Page

 suryaa30
- Mark as New
- Bookmark
- Subscribe
- Mute
- Subscribe to RSS Feed
- Permalink
- Report Inappropriate Content
YTD calculations
Hi All I am expecting a chart like below.
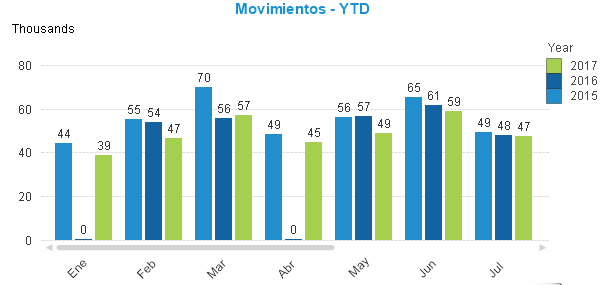
Dimension: Year
Expression: Count(GrossSales_Policy)
Now I want to create a YTD chart. Here YTD means the maximumum date in the maximum year.
so max year is 2017
max date is 27
max month is sep
in the chart i should see data for
1-jan-2016 to 27-Sep-2016
1-jan-2015 to 27-Sep-2015
Individually I have calculated them using below expressions. I want to have a expression to accomodate any number of year's data. so I need not add expression for each year.
if 2016 is selected then for CY=2016
PY=2015
PY_1=2014
eYTDMovementsCY
Count({<Year={'$(=Max(Year))'},Date3={"<=$(=$(vSelectYrDate))"},Month=>}GrossSales_Policy)
eYTDMovementsPY
Count({<Year={'$(=Max(Year)-1)'},Date3={"<=$(=$(vPrevYrDate))"},Month=>}GrossSales_Policy)
vMaxYear Year(Max(Date3))
vMaxPrYear Year(Max(Date3))-1
vAllMaxMonth Num(Month(Max( ALL Date3)))
vAllMaxDate Date(Max(ALL Date3), 'DD-MMM-YY')
vAllMaxDay Day(Max(ALL Date3))
vSelectYrDate Date(MakeDate($(vMaxYear),$(vAllMaxMonth),$(vAllMaxDay)), 'DD-MMM-YY')
vPrevYrDate Date(MakeDate($(vMaxPrYear),$(vAllMaxMonth),$(vAllMaxDay)), 'DD-MMM-YY')
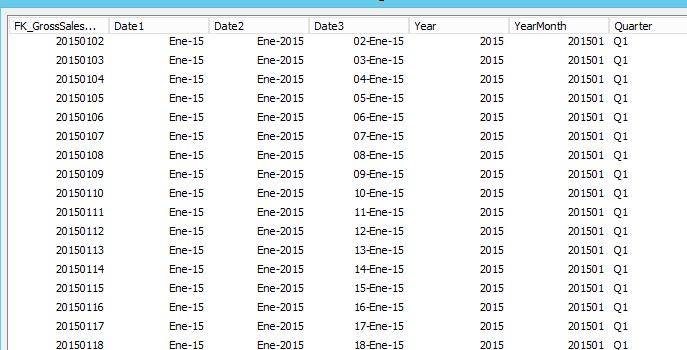
master calendar used;
- Tags:
- set expression
suryaa30
- Mark as New
- Bookmark
- Subscribe
- Mute
- Subscribe to RSS Feed
- Permalink
- Report Inappropriate Content
Forgot to mention that In YTD the valyues for each month should be accumulative.
Actual:
2011
Jan-10
Feb-20
Mar-30
YTD:
2011
Jan-10
Feb-30(10+20)
Mar-40((10+20+30)

 sunny_talwar
- Mark as New
- Bookmark
- Subscribe
- Mute
- Subscribe to RSS Feed
- Permalink
- Report Inappropriate Content
This?
Aggr(RangeSum(Above(Sum({<[Trade Date] = {"=SetDateYear([Trade Date], Max(TOTAL Year)) <= Max(TOTAL [Trade Date])"}>} [Trade Revenue]), 0, RowNo())), Year, Month)
suryaa30
- Mark as New
- Bookmark
- Subscribe
- Mute
- Subscribe to RSS Feed
- Permalink
- Report Inappropriate Content
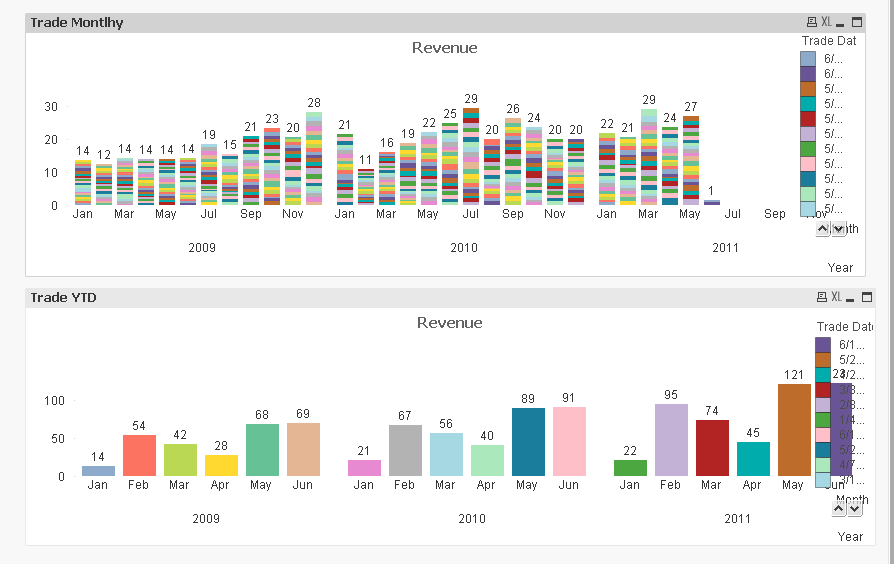
The values dont add up properly,
for convenience I have used sum([Trade Revenue])/100000000
sunny_talwar
- Mark as New
- Bookmark
- Subscribe
- Mute
- Subscribe to RSS Feed
- Permalink
- Report Inappropriate Content
Use this if you have QV12 or above
Aggr(RangeSum(Above(Sum({<[Trade Date] = {"=SetDateYear([Trade Date], Max(TOTAL Year)) <= Max(TOTAL [Trade Date])"}>} [Trade Revenue])/100000000, 0, RowNo())), Year, (Month,(NUMERIC)))
suryaa30
- Mark as New
- Bookmark
- Subscribe
- Mute
- Subscribe to RSS Feed
- Permalink
- Report Inappropriate Content
My Bad it is 11.20.... So any work around? should I settle for Individual values?
thank You very Much
sunny_talwar
- Mark as New
- Bookmark
- Subscribe
- Mute
- Subscribe to RSS Feed
- Permalink
- Report Inappropriate Content
The problem is the your Month field is not sorted in the correct order... Seems like you have a master calendar setup in your app but it is getting loaded from a qvw... if you can sort the data in your qvw... it will work...
sunny_talwar
- Mark as New
- Bookmark
- Subscribe
- Mute
- Subscribe to RSS Feed
- Permalink
- Report Inappropriate Content
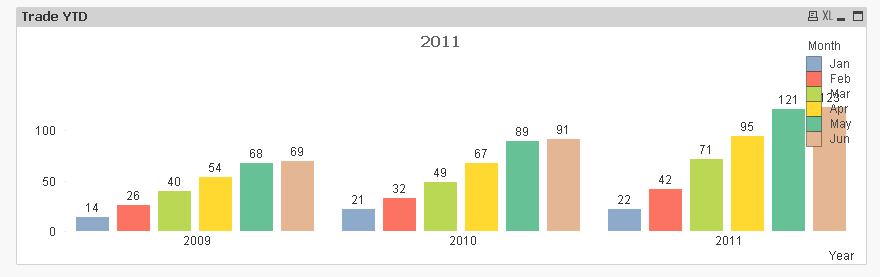
Alternatively, if you can keep Year as your first dimension and Month as second dimension... this can work (without aggr)
RangeSum(Above(Sum({<[Trade Date] = {"=SetDateYear([Trade Date], Max(TOTAL Year)) <= Max(TOTAL [Trade Date])"}>} [Trade Revenue])/100000000, 0, RowNo()))
suryaa30
- Mark as New
- Bookmark
- Subscribe
- Mute
- Subscribe to RSS Feed
- Permalink
- Report Inappropriate Content
So I should be sorting my entire Fact Table on Trade Date in the script? Although this is just a sample data let me give it a try.
Thank you so much
sunny_talwar
- Mark as New
- Bookmark
- Subscribe
- Mute
- Subscribe to RSS Feed
- Permalink
- Report Inappropriate Content
Not the trade date.... but if you can sort your master calendar, then that will do it....
suryaa30
- Mark as New
- Bookmark
- Subscribe
- Mute
- Subscribe to RSS Feed
- Permalink
- Report Inappropriate Content
Appreciate your Time Thanks Much
