Unlock a world of possibilities! Login now and discover the exclusive benefits awaiting you.

- Qlik Community
- :
- All Forums
- :
- QlikView
- :
- Re: Year and Month wise data not matching
- Subscribe to RSS Feed
- Mark Topic as New
- Mark Topic as Read
- Float this Topic for Current User
- Bookmark
- Subscribe
- Mute
- Printer Friendly Page

 amit_saini
- Mark as New
- Bookmark
- Subscribe
- Mute
- Subscribe to RSS Feed
- Permalink
- Report Inappropriate Content
Year and Month wise data not matching
Hi Folks,
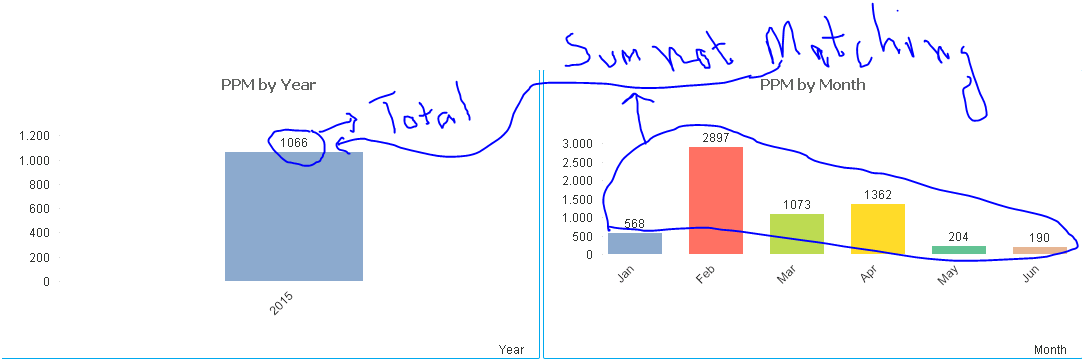
I'm doing very simple calculation by using Year and Month as dimensions in bar chart , but my numbers is not matching.
Expression in both cases :
sum({< Defect_Description=, Complaint_Acceptance-={'4','5','6','7'}> }QTY_PPM*Top_Pos_Flag) / sum(QTY_Delivered_TOTAL) *1000000
Thanks,
AS
- « Previous Replies
-
- 1
- 2
- Next Replies »

 sunny_talwar
- Mark as New
- Bookmark
- Subscribe
- Mute
- Subscribe to RSS Feed
- Permalink
- Report Inappropriate Content
Would you be able to share a sample?
sunny_talwar
- Mark as New
- Bookmark
- Subscribe
- Mute
- Subscribe to RSS Feed
- Permalink
- Report Inappropriate Content
Are you not getting any results? or the results you are getting are not right:
Try this as well:
Sum(Aggr(Sum({< Defect_Description=, Complaint_Acceptance-={'4','5','6','7'}> }QTY_PPM*Top_Pos_Flag) / sum(QTY_Delivered_TOTAL) *1000000, UniqueField))
amit_saini
- Mark as New
- Bookmark
- Subscribe
- Mute
- Subscribe to RSS Feed
- Permalink
- Report Inappropriate Content
PFA
sunny_talwar
- Mark as New
- Bookmark
- Subscribe
- Mute
- Subscribe to RSS Feed
- Permalink
- Report Inappropriate Content
Wow, this is huge 
sunny_talwar
- Mark as New
- Bookmark
- Subscribe
- Mute
- Subscribe to RSS Feed
- Permalink
- Report Inappropriate Content
Here, this formula seems to work:
=Sum(Aggr(sum({< Defect_Description=, Complaint_Acceptance-={'4','5','6','7'}> }QTY_PPM*Top_Pos_Flag)/
sum({< Defect_Description=, Complaint_Acceptance-={'4','5','6','7'}> }QTY_Delivered_TOTAL) *1000000, Month))
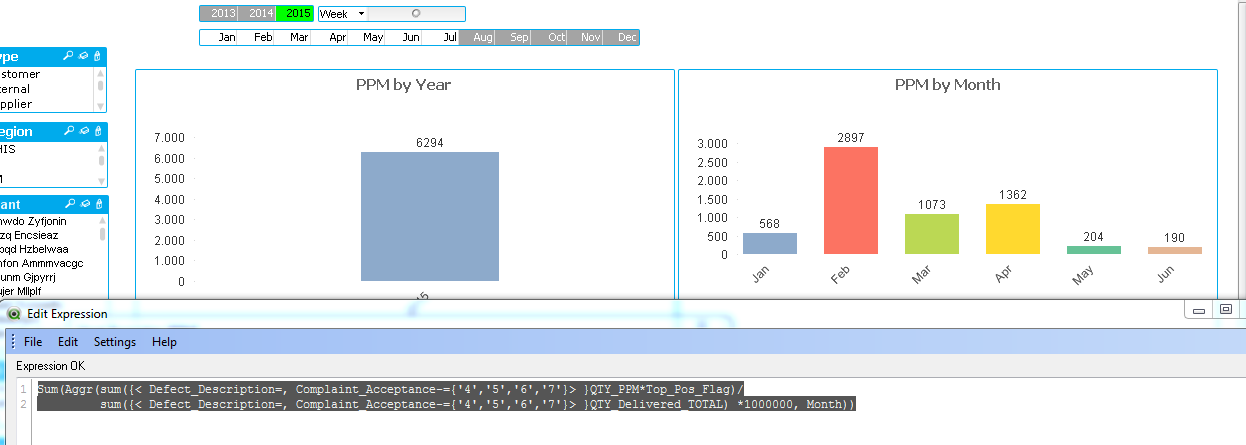
But this is aggregating on the Month Column and in your case I would try to aggregate on a unique column. What is a unique key in your fact table?

- « Previous Replies
-
- 1
- 2
- Next Replies »