Unlock a world of possibilities! Login now and discover the exclusive benefits awaiting you.

- Qlik Community
- :
- All Forums
- :
- QlikView
- :
- Re: Year over Year pace
- Subscribe to RSS Feed
- Mark Topic as New
- Mark Topic as Read
- Float this Topic for Current User
- Bookmark
- Subscribe
- Mute
- Printer Friendly Page

 hobanwashburne
- Mark as New
- Bookmark
- Subscribe
- Mute
- Subscribe to RSS Feed
- Permalink
- Report Inappropriate Content
Year over Year pace
I'm trying to create a chart similar to the following
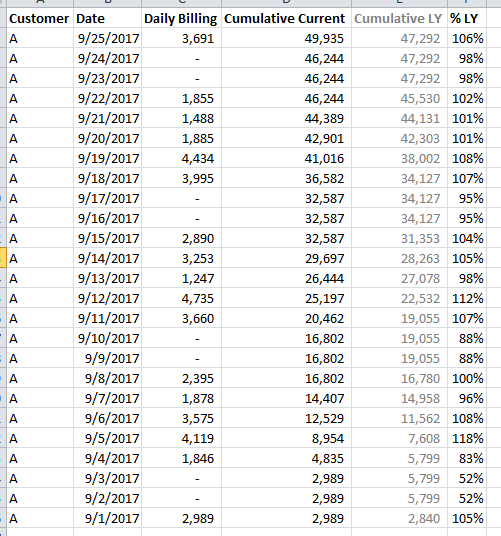
where Daily Billing is the incoming for that day, Cumulative Current is the running total of the Daily Billing, and % LY is the Current Cumulative compared with last year. The cumulative of last year does not need to be shown, only the % LY.
So far no combination of RangeSum or other aggregation has been effective. I have attached the sample data of three customers from 4/1/16 through 9/25/17. The fiscal year begins on 4/1 so the accumulation from last year should begin at 4/1/16 and current year should begin at 4/1/17.
Accepted Solutions

 sunny_talwar
- Mark as New
- Bookmark
- Subscribe
- Mute
- Subscribe to RSS Feed
- Permalink
- Report Inappropriate Content
Try now.... it seems that you are not using QV12 or above and that is by sorting within the aggr() function did not work...
sunny_talwar
- Mark as New
- Bookmark
- Subscribe
- Mute
- Subscribe to RSS Feed
- Permalink
- Report Inappropriate Content
May be like attached?
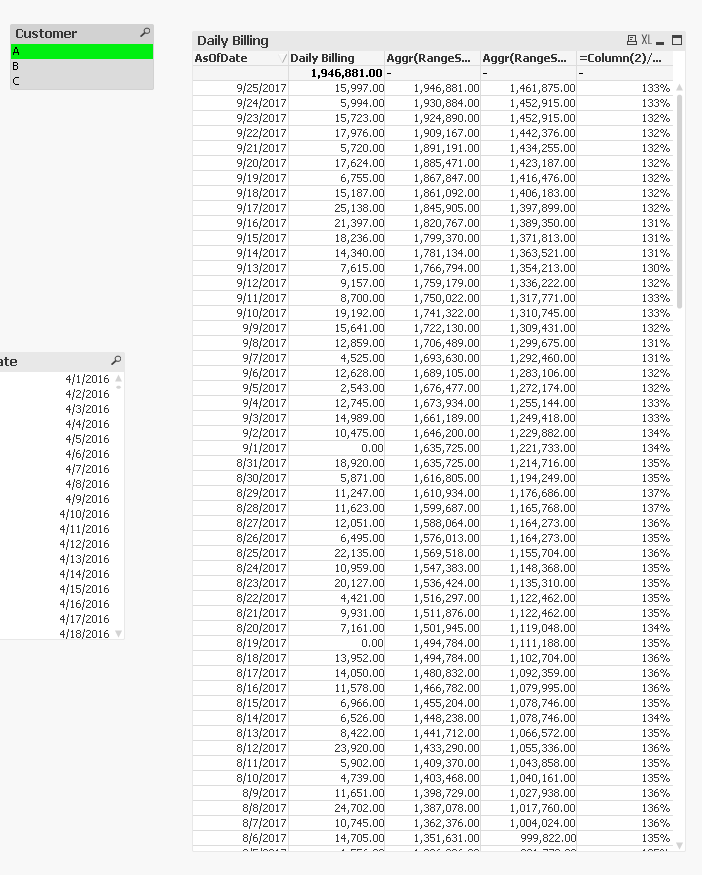
hobanwashburne
- Mark as New
- Bookmark
- Subscribe
- Mute
- Subscribe to RSS Feed
- Permalink
- Report Inappropriate Content
Yes, but the chart does not work when I open your file.
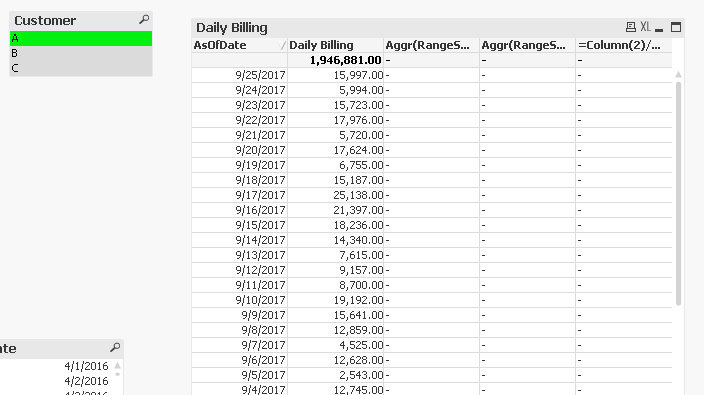
sunny_talwar
- Mark as New
- Bookmark
- Subscribe
- Mute
- Subscribe to RSS Feed
- Permalink
- Report Inappropriate Content
Try now.... it seems that you are not using QV12 or above and that is by sorting within the aggr() function did not work...
