Unlock a world of possibilities! Login now and discover the exclusive benefits awaiting you.
- Qlik Community
- :
- All Forums
- :
- QlikView
- :
- Re: Year vs. year prior help
- Subscribe to RSS Feed
- Mark Topic as New
- Mark Topic as Read
- Float this Topic for Current User
- Bookmark
- Subscribe
- Mute
- Printer Friendly Page
- Mark as New
- Bookmark
- Subscribe
- Mute
- Subscribe to RSS Feed
- Permalink
- Report Inappropriate Content
Year vs. year prior help
HI,
I have what I hope is a simple fix involving set analysis which. I can't get to work properly. I have data broken down by month (numerical) and years. I am having two issues when trying to create a bar graph.
1. The data is plotting as a summation of the year ie continually going up verus just a month to date number. Any thoughts?
2. Given the way the date is represented, which is the best way for my to plot year vs year prior data, and then be able to break down to month versus month year prior.
THank you for the help in advance!
- Tags:
- yearvsyearprior
- « Previous Replies
-
- 1
- 2
- Next Replies »
- Mark as New
- Bookmark
- Subscribe
- Mute
- Subscribe to RSS Feed
- Permalink
- Report Inappropriate Content
Hi Justin,
can you share the app or screenshot? That will be helpful to understand the requirment.
Regards
KC
KC
- Mark as New
- Bookmark
- Subscribe
- Mute
- Subscribe to RSS Feed
- Permalink
- Report Inappropriate Content
KC,
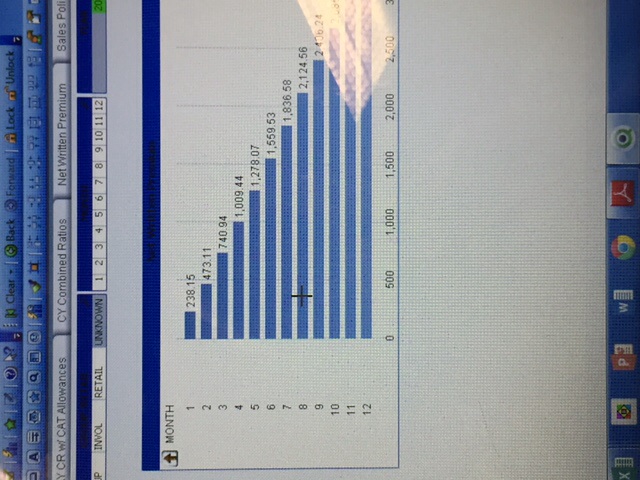
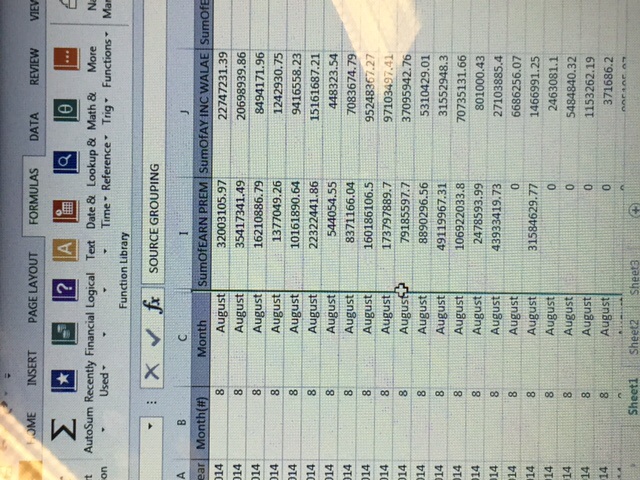
Here are a couple of pictures of my file. I am looking to sum the premium data but only showing for the month To date. Also, looking to view year over year.
- Mark as New
- Bookmark
- Subscribe
- Mute
- Subscribe to RSS Feed
- Permalink
- Report Inappropriate Content
Hi Justin,
try this may be helpful.
Regards
KC
KC
- Mark as New
- Bookmark
- Subscribe
- Mute
- Subscribe to RSS Feed
- Permalink
- Report Inappropriate Content
I moved your question to the QlikView development forum, based on your QlikView screenshots. The question was originally posted in the Qlik Sense forum.
- Mark as New
- Bookmark
- Subscribe
- Mute
- Subscribe to RSS Feed
- Permalink
- Report Inappropriate Content
KC,
Thank you for the help. I have the personal edition currently till work upgrades. Any type of work through?
- Mark as New
- Bookmark
- Subscribe
- Mute
- Subscribe to RSS Feed
- Permalink
- Report Inappropriate Content
Hi justin,
Create a new field in script:
Rowno() & Month as New_Month
Take this field as Dimension
And in expression take:
SumofEran PREM
Hope it will work
KC
- Mark as New
- Bookmark
- Subscribe
- Mute
- Subscribe to RSS Feed
- Permalink
- Report Inappropriate Content
KC,
That didn't seem to work as I need to have the month name still in there and the expression above gave me over 5000 combinations. It seems like a function similar to could work:
If(RowNo() = 1, [SumofNetWritPrem], [SumofNetWritPrem]-Peek([SumofNetWritPrem],-1))
I just can't seem to get the syntax to work. In my data set there are 5 years of data. The data works properly in month one, but each month subsequent is not working proper. Any thoughts?
- Mark as New
- Bookmark
- Subscribe
- Mute
- Subscribe to RSS Feed
- Permalink
- Report Inappropriate Content
Hi, Justin.
Have you seen Steve's post on this ? It may give you some insight into how to build your prior year comparison.
QlikView App: Set Analysis - Prior Period Comparison
Cheers,
Neil
- Mark as New
- Bookmark
- Subscribe
- Mute
- Subscribe to RSS Feed
- Permalink
- Report Inappropriate Content
Neil,
Thank you for the help. I tried that method, but I couldn't get it to work. Since I am on Personal edition for now, I couldn't include his work. My data includes Month and Year and not date. How should I append the data to properly use the variable including date.
The problem with my data seems to be as follows. There are 30,000+ lines of data, and when I graph the sum of the field, it brings up aggregate data. I have tried several methods but ultimately I seem to be missing the correct method. I ultimately need month 1 which is showing correct data per each year, then I need the difference for each other month, such as the difference between (FEB and JAN) or (MAR and FEB) and so on. I assume I need some sort of IF statement or set analysis but I am unsure of the syntax.
- « Previous Replies
-
- 1
- 2
- Next Replies »