Unlock a world of possibilities! Login now and discover the exclusive benefits awaiting you.

- Qlik Community
- :
- All Forums
- :
- QlikView
- :
- Re: bar chart
- Subscribe to RSS Feed
- Mark Topic as New
- Mark Topic as Read
- Float this Topic for Current User
- Bookmark
- Subscribe
- Mute
- Printer Friendly Page

- Mark as New
- Bookmark
- Subscribe
- Mute
- Subscribe to RSS Feed
- Permalink
- Report Inappropriate Content
bar chart
HI friends,
i have a table with four columns student, subject1, subject2, subject3 for every student a grade is given 1 is min and 10 max
sample dataset
student. Sub1 sub2 sub3
stUd1. 6. 5. 8
stud2. 4. 6. 9
stud3. 8. 3. 1
soon
now i want a bar chart
denmension as grade 1 to 10 (im using valueloop (1,10,1)
in expression i want the count like number of grade 1, count of grade 2 soon
please write the expression in the post i have a qlikview personal edition
- Tags:
- qlikview

 sunny_talwar
- Mark as New
- Bookmark
- Subscribe
- Mute
- Subscribe to RSS Feed
- Permalink
- Report Inappropriate Content
May be try with CrossTable Load:
Table:
CrossTable(Subject, Score)
LOAD * Inline [
student, Sub1, sub2, sub3
stud1, 6, 5, 8
stud2, 4, 6, 9
stud3, 8, 3, 1
];
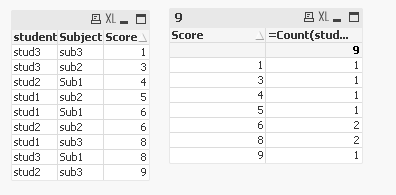
 Chanty4u
- Mark as New
- Bookmark
- Subscribe
- Mute
- Subscribe to RSS Feed
- Permalink
- Report Inappropriate Content
may be this
- Mark as New
- Bookmark
- Subscribe
- Mute
- Subscribe to RSS Feed
- Permalink
- Report Inappropriate Content
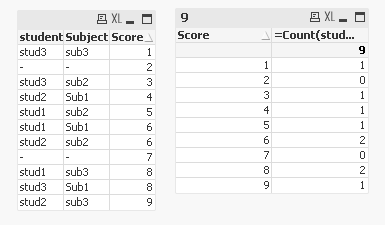
thanks sunny. But i want to show other grade as well in the bar chart which is missing in dataset like 2,7 and 10
sunny_talwar
- Mark as New
- Bookmark
- Subscribe
- Mute
- Subscribe to RSS Feed
- Permalink
- Report Inappropriate Content
May be add an inline table with all possible score:
LOAD * Inline [
Score
1
2
3
4
5
6
7
8
9
];
Table:
CrossTable(Subject, Score)
LOAD * Inline [
student, Sub1, sub2, sub3
stud1, 6, 5, 8
stud2, 4, 6, 9
stud3, 8, 3, 1
];