Unlock a world of possibilities! Login now and discover the exclusive benefits awaiting you.

- Qlik Community
- :
- All Forums
- :
- QlikView
- :
- Re: bar graph
- Subscribe to RSS Feed
- Mark Topic as New
- Mark Topic as Read
- Float this Topic for Current User
- Bookmark
- Subscribe
- Mute
- Printer Friendly Page

- Mark as New
- Bookmark
- Subscribe
- Mute
- Subscribe to RSS Feed
- Permalink
- Report Inappropriate Content
bar graph
Hi all,
In my bar graph, how can i show the values and percentage both together on bar.(By using values on data point)
thanks
- Tags:
- new_to_qlikview

 MK_QSL
- Mark as New
- Bookmark
- Subscribe
- Mute
- Subscribe to RSS Feed
- Permalink
- Report Inappropriate Content
Consider you have Customer, Sales and Purchase data...
Create a Bar Chart
Dimension
Customer
Expressions
1) SUM(Sales)
Tick Bar and Untick Values on Data Points
2) 'Sales : '&SUM(Sales) & CHR(10) & NUM((SUM(Sales)-Sum(Purhcase))/SUM(Sales),'#,##0.00%')
Untick Bar Chart
Tick Values on Data Points
Change Dimension and Expressions according to your database and requirements..
- Mark as New
- Bookmark
- Subscribe
- Mute
- Subscribe to RSS Feed
- Permalink
- Report Inappropriate Content
thanks for effort but i couldnt follow..
can u help with simple solution
thanks

 ashfaq_haseeb
- Mark as New
- Bookmark
- Subscribe
- Mute
- Subscribe to RSS Feed
- Permalink
- Report Inappropriate Content
Hi,
Have a look at attached application.
Regards
ASHFAQ
MK_QSL
- Mark as New
- Bookmark
- Subscribe
- Mute
- Subscribe to RSS Feed
- Permalink
- Report Inappropriate Content
Check enclosed file...

 engishfaque
- Mark as New
- Bookmark
- Subscribe
- Mute
- Subscribe to RSS Feed
- Permalink
- Report Inappropriate Content
Dear Deepak,
Chart Properties > Expressions > Check to "Relative" Check box.
Kind regards,
Ishfaque Ahmed
 MarcoWedel
- Mark as New
- Bookmark
- Subscribe
- Mute
- Subscribe to RSS Feed
- Permalink
- Report Inappropriate Content
Hi,
one solution:
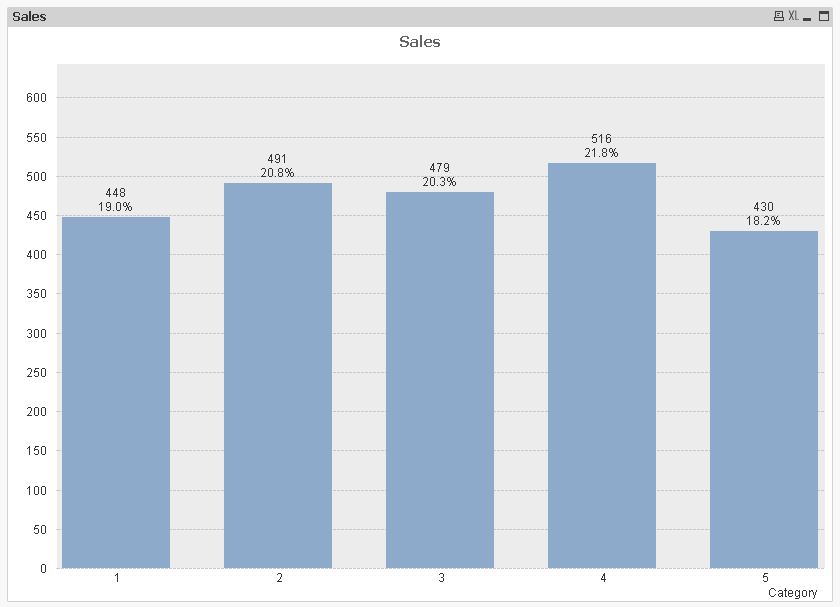
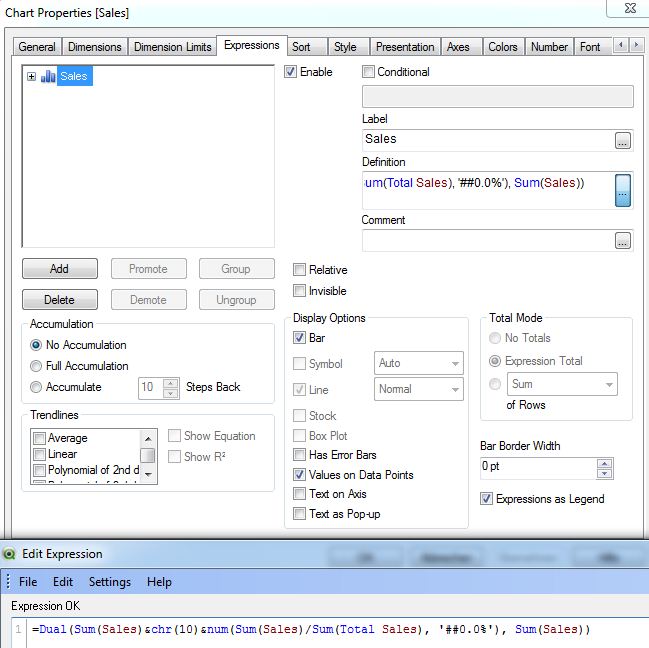
hope this helps
regards
Marco
- Mark as New
- Bookmark
- Subscribe
- Mute
- Subscribe to RSS Feed
- Permalink
- Report Inappropriate Content
i cant understand the expression
MK_QSL
- Mark as New
- Bookmark
- Subscribe
- Mute
- Subscribe to RSS Feed
- Permalink
- Report Inappropriate Content
Dual Function will have two values...
Dual(A,B).... A is Text and B is Numeric
Sum(Sales) & Chr(10) & Num(Sum(Sales) / Sum(Total Sales),'##0.0%') Text
need to divided into
Sum(Sales) ==> Total Sales for each Category
Sum(Sales) / Sum(Total Sales) ==> Total Sales for each Category / Total Sales
Num(Sum(Sales) / Sum(Total Sales),'##0.0%') ==> Convert above in to %
Chr(10) will make another line./ New Line Feed...
Sum(Sales) Numeric
Hope this helps....