Unlock a world of possibilities! Login now and discover the exclusive benefits awaiting you.

- Qlik Community
- :
- All Forums
- :
- QlikView
- :
- Re: distribution over possible values
- Subscribe to RSS Feed
- Mark Topic as New
- Mark Topic as Read
- Float this Topic for Current User
- Bookmark
- Subscribe
- Mute
- Printer Friendly Page

 marikabi
- Mark as New
- Bookmark
- Subscribe
- Mute
- Subscribe to RSS Feed
- Permalink
- Report Inappropriate Content
distribution over possible values
dear all,
writing you about an issue i don't know how to solve.
I'm trying to display a line chart where i want to show the distribution of shops over all possible values.
I loaded all possible values as dimension AXE (basically it's the range 0->1, with step 0.01).
For each shop, i want to calculate the percentage of sales on the total.
Example:
shop 1 , sales=2 -> %sales=10%
shop 2, sales=5 -> %sales=25%
shop 3, sales=8 -> %sales=40%
shop 4, sales=5 ->%sales=25%
My expected output would be a line chart where axe X are all values from 0 till 100%, and for X=10% i get 1, for X=25% i get 2 and for X=40% i get 1.
Any idea how to solve this? thanks
Accepted Solutions

 rubenmarin
- Mark as New
- Bookmark
- Subscribe
- Mute
- Subscribe to RSS Feed
- Permalink
- Report Inappropriate Content
Hi @marikabi, you can set as calculated dimension: =Aggr(Num(Round(Sum(Sales)/Sum(TOTAL Sales),0.01), '0%'), Shop)
Expression: Count(Shop)
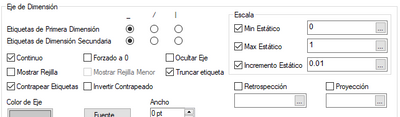
This will show an axis with only 10%, 25% and 40%, if you want x axis from 0 to 100% you can set this in Axis tab, set 'Continuous' for axis dimension and the range from 0 to 1 in 0.01 steps, optionally you set vertical labels to show more axis values.
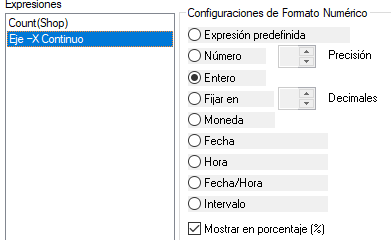
In Numbers tab there is an option to show axis values as percentage
rubenmarin
- Mark as New
- Bookmark
- Subscribe
- Mute
- Subscribe to RSS Feed
- Permalink
- Report Inappropriate Content
Hi @marikabi, you can set as calculated dimension: =Aggr(Num(Round(Sum(Sales)/Sum(TOTAL Sales),0.01), '0%'), Shop)
Expression: Count(Shop)
This will show an axis with only 10%, 25% and 40%, if you want x axis from 0 to 100% you can set this in Axis tab, set 'Continuous' for axis dimension and the range from 0 to 1 in 0.01 steps, optionally you set vertical labels to show more axis values.
In Numbers tab there is an option to show axis values as percentage
marikabi
- Mark as New
- Bookmark
- Subscribe
- Mute
- Subscribe to RSS Feed
- Permalink
- Report Inappropriate Content
amazing! This works perfectly 🙂
thank you
