Unlock a world of possibilities! Login now and discover the exclusive benefits awaiting you.

- Qlik Community
- :
- All Forums
- :
- QlikView
- :
- Re: range
- Subscribe to RSS Feed
- Mark Topic as New
- Mark Topic as Read
- Float this Topic for Current User
- Bookmark
- Subscribe
- Mute
- Printer Friendly Page

 soniasweety
- Mark as New
- Bookmark
- Subscribe
- Mute
- Subscribe to RSS Feed
- Permalink
- Report Inappropriate Content
range
Hi all,
i want to show the bg colour based on below range
Which ever code is less than 97% or >103% those should bg color red
With in that green range ( 97% -103%) -- stright table
[ i need the rate column values should show in % like 100.00%]
- « Previous Replies
-
- 1
- 2
- Next Replies »

- Mark as New
- Bookmark
- Subscribe
- Mute
- Subscribe to RSS Feed
- Permalink
- Report Inappropriate Content
to Show the rate in % you may define the Format under tab Settings/Document properties/number
but rate will Show as 10000%
I wopuld prefer to define rate as Expression, there you can define only(rate/100) and under tab number you may format as percent
for Background colour ypu may define background Color
I would not Color all values. only those rates which i want Attention for user should be colored
(but some customer want all values colored)

soniasweety
- Mark as New
- Bookmark
- Subscribe
- Mute
- Subscribe to RSS Feed
- Permalink
- Report Inappropriate Content
thanks for your reply.. but if i add as expression rate/100 its showing only some values as percentage rest it is showing null, but for that id's i have rate value.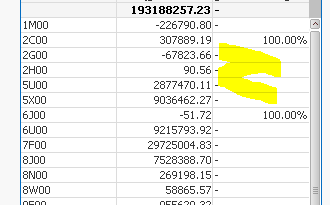
 HirisH_V7
- Mark as New
- Bookmark
- Subscribe
- Mute
- Subscribe to RSS Feed
- Permalink
- Report Inappropriate Content
Hi
Please check using below expression in, Background color.
=IF(Num(rate/100,'#,##0.00%')>'97.00%' and Num(rate/100,'#,##0.00%')<'103.00%',lightGreen(),lightREd())
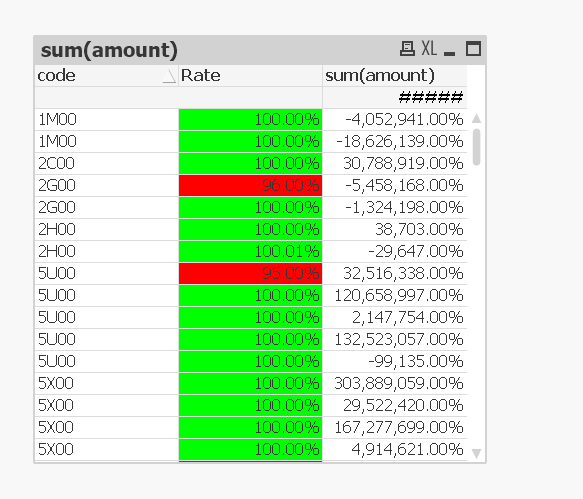
PFA
HTH
Hirish
 Frank_Hartmann
- Mark as New
- Bookmark
- Subscribe
- Mute
- Subscribe to RSS Feed
- Permalink
- Report Inappropriate Content
maybe like attached
hope this helps
soniasweety
- Mark as New
- Bookmark
- Subscribe
- Mute
- Subscribe to RSS Feed
- Permalink
- Report Inappropriate Content
Oh you are done on code column  i need in rate column .. i will manage that,
but one more thing here.. i want to show two KPI text objects with that green count and red count how can i do that?
soniasweety
- Mark as New
- Bookmark
- Subscribe
- Mute
- Subscribe to RSS Feed
- Permalink
- Report Inappropriate Content
yes its looks good. but i need to change the expression like below
and i need to convert the rate in script only.
=IF(Num(rate,'#,##0.00%')>'97.00%' and Num(rate,'#,##0.00%')<'103.00%',lightGreen(),lightREd())

 andrey_krylov
- Mark as New
- Bookmark
- Subscribe
- Mute
- Subscribe to RSS Feed
- Permalink
- Report Inappropriate Content
Like this?
Frank_Hartmann
- Mark as New
- Bookmark
- Subscribe
- Mute
- Subscribe to RSS Feed
- Permalink
- Report Inappropriate Content
textbox1(red):
=sum(aggr(sum(if(rate>103 or rate < 97,1,0)),code))
textbox2(green):
=sum(aggr(sum(if(rate>103 or rate < 97,0,1)),code))
soniasweety
- Mark as New
- Bookmark
- Subscribe
- Mute
- Subscribe to RSS Feed
- Permalink
- Report Inappropriate Content
its looks exactly what i need ,.. but if you export the table im getting the wrong count for green .. red it is showing correct
how come it is like that? did i miss anything?
- « Previous Replies
-
- 1
- 2
- Next Replies »