Unlock a world of possibilities! Login now and discover the exclusive benefits awaiting you.

- Qlik Community
- :
- All Forums
- :
- QlikView
- :
- separate values in a table
- Subscribe to RSS Feed
- Mark Topic as New
- Mark Topic as Read
- Float this Topic for Current User
- Bookmark
- Subscribe
- Mute
- Printer Friendly Page

- Mark as New
- Bookmark
- Subscribe
- Mute
- Subscribe to RSS Feed
- Permalink
- Report Inappropriate Content
separate values in a table
Hi best friends!
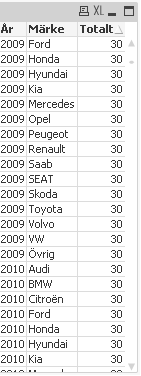
I would like to create diagrams for each car brand for themselves and it should show a TOTAL value for each year , but the must important thing is to separate the brands so each diagram shows a single car brand with TOTAL & YEAR.
- Tags:
- new_to_qlikview
- Mark as New
- Bookmark
- Subscribe
- Mute
- Subscribe to RSS Feed
- Permalink
- Report Inappropriate Content
you can define Trellis (e.g. barchart: tab Dimension, button at bottom) for your Dimension brand
in straight table you get a table per Dimension (brand and year)
- Mark as New
- Bookmark
- Subscribe
- Mute
- Subscribe to RSS Feed
- Permalink
- Report Inappropriate Content
Hi,
According to my understanding Pivot Table should fits your requirement,
where Car brand & year as dimension.
if not please give more explanation and sample output.
- Mark as New
- Bookmark
- Subscribe
- Mute
- Subscribe to RSS Feed
- Permalink
- Report Inappropriate Content
Please, do not duplicate questions:

 alexandros17
- Mark as New
- Bookmark
- Subscribe
- Mute
- Subscribe to RSS Feed
- Permalink
- Report Inappropriate Content
A trellis is a good option but I should use a pivot table because the large amounts of brands ...

 Kushal_Chawda
- Mark as New
- Bookmark
- Subscribe
- Mute
- Subscribe to RSS Feed
- Permalink
- Report Inappropriate Content
Use Pivot Table