Unlock a world of possibilities! Login now and discover the exclusive benefits awaiting you.

- Qlik Community
- :
- All Forums
- :
- QlikView
- :
- Re: sort on bar chart based on expression issue
- Subscribe to RSS Feed
- Mark Topic as New
- Mark Topic as Read
- Float this Topic for Current User
- Bookmark
- Subscribe
- Mute
- Printer Friendly Page

 alec1982
- Mark as New
- Bookmark
- Subscribe
- Mute
- Subscribe to RSS Feed
- Permalink
- Report Inappropriate Content
sort on bar chart based on expression issue
Hi all,
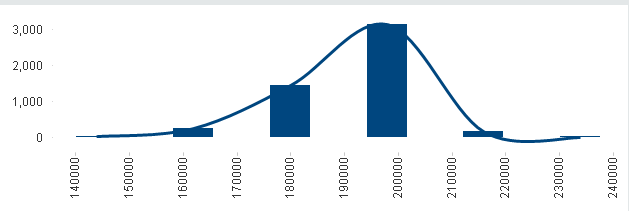
I am in a need to sort a bar chart based on count. but i need to show only 9 bars. the highest in the middle and then 4 on each side descending both side to create a histogram..
Anyone knows how can I do it?
Accepted Solutions

 MarcoWedel
- Mark as New
- Bookmark
- Subscribe
- Mute
- Subscribe to RSS Feed
- Permalink
- Report Inappropriate Content
Hi,
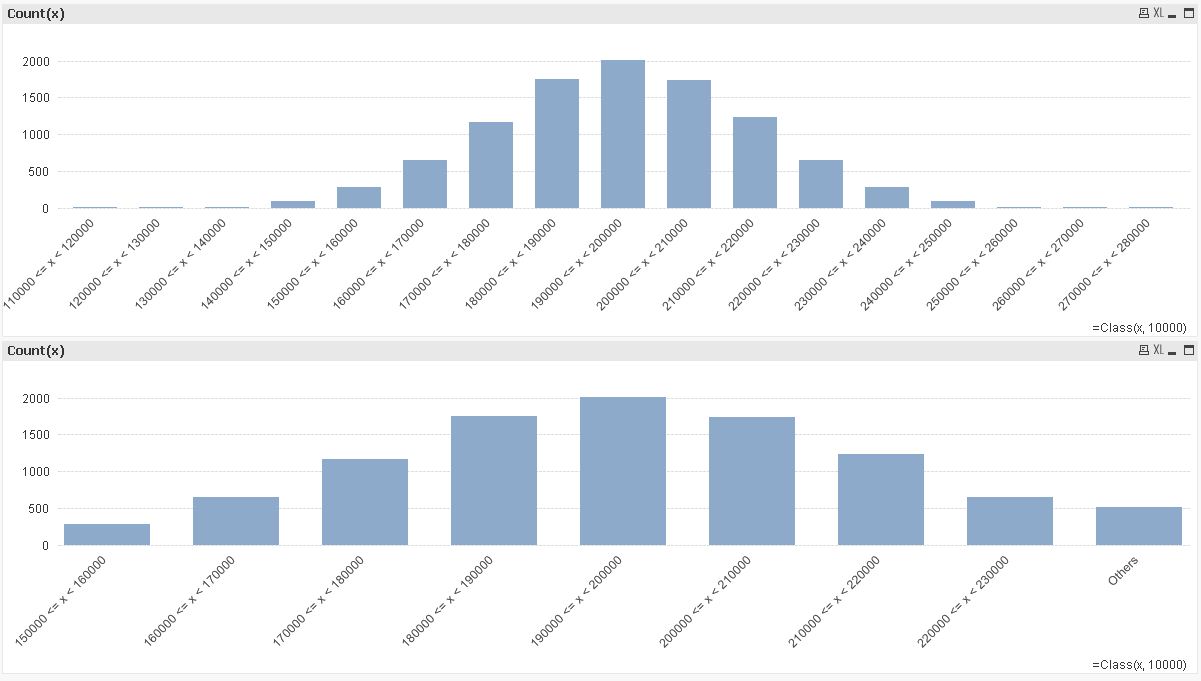
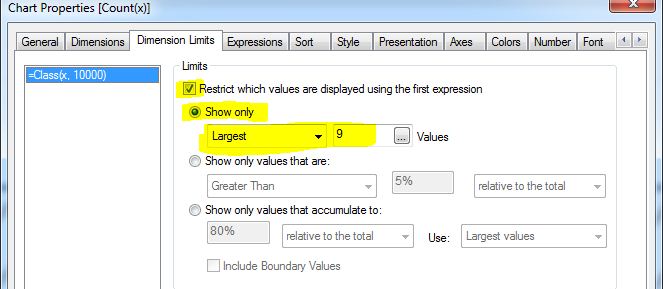
the easiest solution might be to define dimension limits (provided the largest numbers are always coherent):
hope this helps
regards
Marco
 sunny_talwar
- Mark as New
- Bookmark
- Subscribe
- Mute
- Subscribe to RSS Feed
- Permalink
- Report Inappropriate Content
We may be able to help, but we need to look at a sample. Can you provide one? 
Best,
Sunny
alec1982
- Mark as New
- Bookmark
- Subscribe
- Mute
- Subscribe to RSS Feed
- Permalink
- Report Inappropriate Content
thank you. here is a sample image.
alec1982
- Mark as New
- Bookmark
- Subscribe
- Mute
- Subscribe to RSS Feed
- Permalink
- Report Inappropriate Content
listed at the post body
sunny_talwar
- Mark as New
- Bookmark
- Subscribe
- Mute
- Subscribe to RSS Feed
- Permalink
- Report Inappropriate Content
By sample I meant a sample qvw document or sample excel file which can be loaded into the application to try it out. Desired or Expected output will be a plus
Sunny
MarcoWedel
- Mark as New
- Bookmark
- Subscribe
- Mute
- Subscribe to RSS Feed
- Permalink
- Report Inappropriate Content
Hi,
the easiest solution might be to define dimension limits (provided the largest numbers are always coherent):
hope this helps
regards
Marco
alec1982
- Mark as New
- Bookmark
- Subscribe
- Mute
- Subscribe to RSS Feed
- Permalink
- Report Inappropriate Content
good idea!
