Unlock a world of possibilities! Login now and discover the exclusive benefits awaiting you.
- Qlik Community
- :
- All Forums
- :
- QlikView
- :
- stacked bar chart 2x dimensions
- Subscribe to RSS Feed
- Mark Topic as New
- Mark Topic as Read
- Float this Topic for Current User
- Bookmark
- Subscribe
- Mute
- Printer Friendly Page
- Mark as New
- Bookmark
- Subscribe
- Mute
- Subscribe to RSS Feed
- Permalink
- Report Inappropriate Content
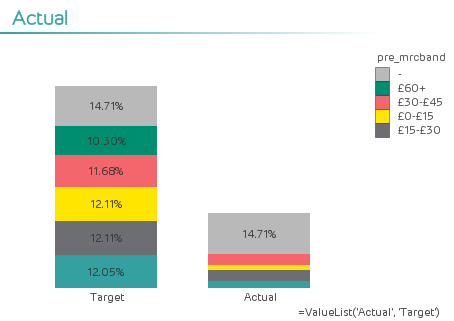
stacked bar chart 2x dimensions
I want to show a stacked bar chart, with dimensions targets and actuals side by side - any ideas ?
- Mark as New
- Bookmark
- Subscribe
- Mute
- Subscribe to RSS Feed
- Permalink
- Report Inappropriate Content
Would you be able to provide a sample with how you expect to see your chart?
- Mark as New
- Bookmark
- Subscribe
- Mute
- Subscribe to RSS Feed
- Permalink
- Report Inappropriate Content
Something like below -targets are pulled in separately to the main load script - the volumes are labelled tarvol and acvol (new to Qlikview so not sure what I am doing) I've tried all ways I can find on Google with the Value list being the closest I have come ...
- Mark as New
- Bookmark
- Subscribe
- Mute
- Subscribe to RSS Feed
- Permalink
- Report Inappropriate Content
Hi,
Check below links.
2-dimension / 2-expression bar chart question
Regards,
Kaushik Solanki
- Mark as New
- Bookmark
- Subscribe
- Mute
- Subscribe to RSS Feed
- Permalink
- Report Inappropriate Content
can you post sample data that replicates your scenario
If a post helps to resolve your issue, please accept it as a Solution.
- Mark as New
- Bookmark
- Subscribe
- Mute
- Subscribe to RSS Feed
- Permalink
- Report Inappropriate Content
Hello Vineeth -
I have my main load
date band obs
Jan £0-£15 300
Jan £15-30 400
Jan £30-£45 500
Jan £45-60 100
Jan £60+ 50
feb mar same with diff vol
second load is targets
date (linked to the date in the first load)
volume 100
150
200
300
does that make sense ?
- Mark as New
- Bookmark
- Subscribe
- Mute
- Subscribe to RSS Feed
- Permalink
- Report Inappropriate Content
Hi,
Not this sample data.
What we are looking is sample QVW file.
See below link for more help.
Preparing examples for Upload - Reduction and Data Scrambling
https://community.qlik.com/docs/DOC-16454
Regards,
Kaushik Solanki
- Mark as New
- Bookmark
- Subscribe
- Mute
- Subscribe to RSS Feed
- Permalink
- Report Inappropriate Content
Thank you for your help - this link has helped me to muddle through 🙂