Unlock a world of possibilities! Login now and discover the exclusive benefits awaiting you.
- Qlik Community
- :
- All Forums
- :
- QlikView
- :
- straight table
- Subscribe to RSS Feed
- Mark Topic as New
- Mark Topic as Read
- Float this Topic for Current User
- Bookmark
- Subscribe
- Mute
- Printer Friendly Page
- Mark as New
- Bookmark
- Subscribe
- Mute
- Subscribe to RSS Feed
- Permalink
- Report Inappropriate Content
straight table
Hi
can we foramat the straight table as below

Thanks@Regards
Panireddy
- Mark as New
- Bookmark
- Subscribe
- Mute
- Subscribe to RSS Feed
- Permalink
- Report Inappropriate Content
you can .
Have you tried View --> Design Grid.
If it is dynamic data uses expression/dimension background color property to write formula with RGB you need
- Mark as New
- Bookmark
- Subscribe
- Mute
- Subscribe to RSS Feed
- Permalink
- Report Inappropriate Content
Yes. Click on the + in front of the dimension on the Dimensions tab of the properties window of the chart. Next select Background Color and click the Edit button. Enter an expression to calculate the color. Something like =if(sum(Value)>=0,color(1), color(2)). For the color of the expression column you do pretty much the same thing on the Expressions tab.
talk is cheap, supply exceeds demand
- Mark as New
- Bookmark
- Subscribe
- Mute
- Subscribe to RSS Feed
- Permalink
- Report Inappropriate Content
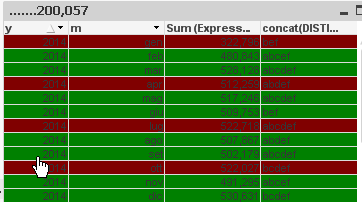
you can set backgroun color of dimensions and expressions
=if(mod(rowno(total),3)=1, red(), green())
- Mark as New
- Bookmark
- Subscribe
- Mute
- Subscribe to RSS Feed
- Permalink
- Report Inappropriate Content
Thank you
- Mark as New
- Bookmark
- Subscribe
- Mute
- Subscribe to RSS Feed
- Permalink
- Report Inappropriate Content
If you get the answer, please close this discussion by giving Correct and Helpful answers to the posts which are useful for you. It helps others in finding answers for similar scenarios.
- Mark as New
- Bookmark
- Subscribe
- Mute
- Subscribe to RSS Feed
- Permalink
- Report Inappropriate Content
Hi
Massimo formula will make it. I tested it and it works
/jo