Unlock a world of possibilities! Login now and discover the exclusive benefits awaiting you.

- Qlik Community
- :
- All Forums
- :
- QlikView
- :
- z-score in table object
- Subscribe to RSS Feed
- Mark Topic as New
- Mark Topic as Read
- Float this Topic for Current User
- Bookmark
- Subscribe
- Mute
- Printer Friendly Page

- Mark as New
- Bookmark
- Subscribe
- Mute
- Subscribe to RSS Feed
- Permalink
- Report Inappropriate Content
z-score in table object
Dear all,
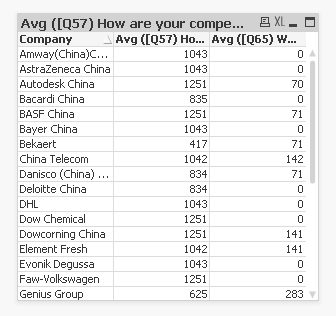
I want to create a table - see image - which show the z-scores for each company (instead of the normal scoring which is currently in the table). Does somebody know the expression to get this done? I can't find it.
ps. z-scores describe the distance of the company score to the mean, expressed in standarddeviation.
Accepted Solutions

 johnw
johnw
- Mark as New
- Bookmark
- Subscribe
- Mute
- Subscribe to RSS Feed
- Permalink
- Report Inappropriate Content
This would be easier with an example file to play with, but let's see. I'm guessing that each company has a single score? So the mean (since you want it in the chart) is probably:
avg(total Score)
And the standard deviation is probably:
stdev(total Score)
And so your z-score would probably be:
(Score - avg(total Score))/stdev(total Score)
johnw
- Mark as New
- Bookmark
- Subscribe
- Mute
- Subscribe to RSS Feed
- Permalink
- Report Inappropriate Content
This would be easier with an example file to play with, but let's see. I'm guessing that each company has a single score? So the mean (since you want it in the chart) is probably:
avg(total Score)
And the standard deviation is probably:
stdev(total Score)
And so your z-score would probably be:
(Score - avg(total Score))/stdev(total Score)
- Mark as New
- Bookmark
- Subscribe
- Mute
- Subscribe to RSS Feed
- Permalink
- Report Inappropriate Content
Fantastic John, It works. Thanks for quick response.

 jmmayoral3
- Mark as New
- Bookmark
- Subscribe
- Mute
- Subscribe to RSS Feed
- Permalink
- Report Inappropriate Content
Very good answer and very simple.
I have espent a lot of time searching a function which does a zcore in the documentation ofSense.