Unlock a world of possibilities! Login now and discover the exclusive benefits awaiting you.

- Qlik Community
- :
- Forums
- :
- Analytics & AI
- :
- Products & Topics
- :
- Visualization and Usability
- :
- 100% stacked bar chart
- Subscribe to RSS Feed
- Mark Topic as New
- Mark Topic as Read
- Float this Topic for Current User
- Bookmark
- Subscribe
- Mute
- Printer Friendly Page

- Mark as New
- Bookmark
- Subscribe
- Mute
- Subscribe to RSS Feed
- Permalink
- Report Inappropriate Content
100% stacked bar chart
Hi guys, this should be easy oneI have seen this is a relatively common question though I am struggling to make my bar chart 100% stacked and wonder if you can help. This is my desired chart output
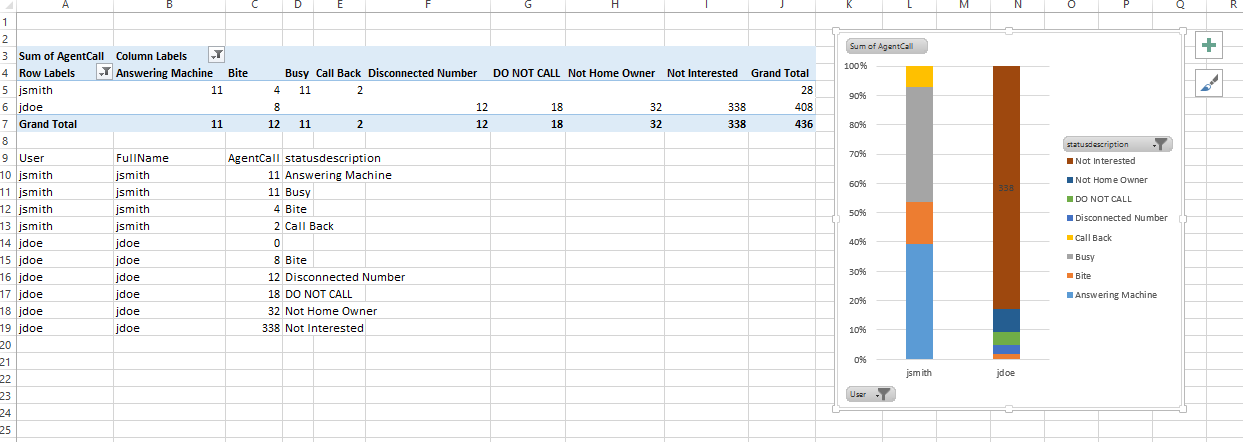
My dimensions are
User
statusdescription
and measure is
sum(AgentCall)
and its working as a stacked chart, but I cant figure out how to make it 100% so I can compare user to user 
Thanks guys
- Tags:
- qliksense chart
Accepted Solutions

 sunny_talwar
- Mark as New
- Bookmark
- Subscribe
- Mute
- Subscribe to RSS Feed
- Permalink
- Report Inappropriate Content

 arulsettu
- Mark as New
- Bookmark
- Subscribe
- Mute
- Subscribe to RSS Feed
- Permalink
- Report Inappropriate Content
may be like this
sum(AgentCall)/sum(Total AgentCall)
change number format to %
sunny_talwar
- Mark as New
- Bookmark
- Subscribe
- Mute
- Subscribe to RSS Feed
- Permalink
- Report Inappropriate Content
Or may be this:
Sum(AgentCall)/Sum(Total <User> AgentCall)

 mgranillo
- Mark as New
- Bookmark
- Subscribe
- Mute
- Subscribe to RSS Feed
- Permalink
- Report Inappropriate Content
Matt,
If that doesn't work, try totaling over your top dimension:
sum(AgentCall)/sum(Total <User> AgentCall)
- Mark as New
- Bookmark
- Subscribe
- Mute
- Subscribe to RSS Feed
- Permalink
- Report Inappropriate Content
Thank you guys, Sunny T and Michaels answer worked for me (sorry it only seems to let me mark one as a correct answer)
I almost had it though the closest I got was
Sum(AgentCall)/Sum(Total <statusdescription> AgentCall)
Instead of
Sum(AgentCall)/Sum(Total <User> AgentCall)
Thanks again