Unlock a world of possibilities! Login now and discover the exclusive benefits awaiting you.

- Qlik Community
- :
- Forums
- :
- Analytics & AI
- :
- Products & Topics
- :
- Visualization and Usability
- :
- Re: Accumulation in Pivot Table
- Subscribe to RSS Feed
- Mark Topic as New
- Mark Topic as Read
- Float this Topic for Current User
- Bookmark
- Subscribe
- Mute
- Printer Friendly Page

 evgeniystuchalk
- Mark as New
- Bookmark
- Subscribe
- Mute
- Subscribe to RSS Feed
- Permalink
- Report Inappropriate Content
Accumulation in Pivot Table
Hello. My question on picture:

Accepted Solutions

- Mark as New
- Bookmark
- Subscribe
- Mute
- Subscribe to RSS Feed
- Permalink
- Report Inappropriate Content
Try this with changing underlined values according to your requirement
If(Dimensionality()=2,rangesum(above( sum(NormalValue), 0, rowno() )),aggr( rangesum(above( sum(NormalValue), 0, rowno() )),Month ) )
 OmarBenSalem
- Mark as New
- Bookmark
- Subscribe
- Mute
- Subscribe to RSS Feed
- Permalink
- Report Inappropriate Content
change your expression as follow:
if(dimensionality()=1, sum(Sales),
if(dimensionality()=2, your expression))
evgeniystuchalk
- Mark as New
- Bookmark
- Subscribe
- Mute
- Subscribe to RSS Feed
- Permalink
- Report Inappropriate Content
thanks. but I need calculate month values also with accumulation
- Mark as New
- Bookmark
- Subscribe
- Mute
- Subscribe to RSS Feed
- Permalink
- Report Inappropriate Content
What value you want to display at months.exactly??
evgeniystuchalk
- Mark as New
- Bookmark
- Subscribe
- Mute
- Subscribe to RSS Feed
- Permalink
- Report Inappropriate Content
AcumSales
| MonthDim | DayDim | Sales | AcumSales |
|---|---|---|---|
| Apr | 7 | 7 | |
| 1 | 1 | 1 | |
| 2 | 2 | 3 | |
| 3 | 4 | 7 | |
| May | 5 | 12 | |
| 1 | 1 | 8 | |
| 2 | 2 | 10 | |
| 3 | 2 | 12 |
OmarBenSalem
- Mark as New
- Bookmark
- Subscribe
- Mute
- Subscribe to RSS Feed
- Permalink
- Report Inappropriate Content
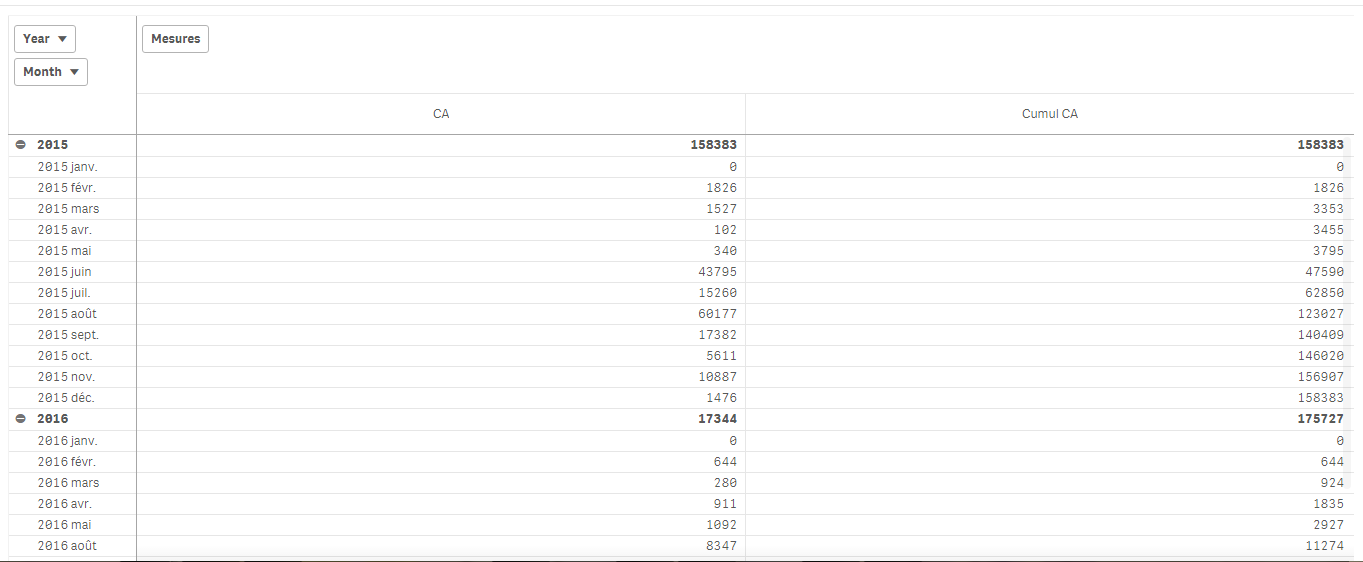
Try this:
if(Dimensionality()=1,aggr(rangesum(Above(aggr(Sum(CA),Month),0,RowNo())),Month), rangesum(Above( Sum(CA),0,RowNo())))
Per analogy, I would have:
- Mark as New
- Bookmark
- Subscribe
- Mute
- Subscribe to RSS Feed
- Permalink
- Report Inappropriate Content
Try this with changing underlined values according to your requirement
If(Dimensionality()=2,rangesum(above( sum(NormalValue), 0, rowno() )),aggr( rangesum(above( sum(NormalValue), 0, rowno() )),Month ) )
evgeniystuchalk
- Mark as New
- Bookmark
- Subscribe
- Mute
- Subscribe to RSS Feed
- Permalink
- Report Inappropriate Content
Thanks!
- Mark as New
- Bookmark
- Subscribe
- Mute
- Subscribe to RSS Feed
- Permalink
- Report Inappropriate Content
Glad it helped you 