Unlock a world of possibilities! Login now and discover the exclusive benefits awaiting you.

- Qlik Community
- :
- Forums
- :
- Analytics & AI
- :
- Products & Topics
- :
- Visualization and Usability
- :
- Add On's / Reference Lines
- Subscribe to RSS Feed
- Mark Topic as New
- Mark Topic as Read
- Float this Topic for Current User
- Bookmark
- Subscribe
- Mute
- Printer Friendly Page

- Mark as New
- Bookmark
- Subscribe
- Mute
- Subscribe to RSS Feed
- Permalink
- Report Inappropriate Content
Add On's / Reference Lines
Hi QS Community,
I have a stacked line chart - see attached pic - and I am trying to add a reference line to it. ( I have drawn this on the attached example - rather badly in black !)
The reference line is our prediction of what will happen and is a complicated process to calculate using probability - so ideally I am trying to over lay a line on this chart without calculating this in a expression.
I can use Add Ons / Reference Line to add in a flat reference line of 600 per quarter, however our prediction line is variable 600/700/900/1250/400/300 and so on...
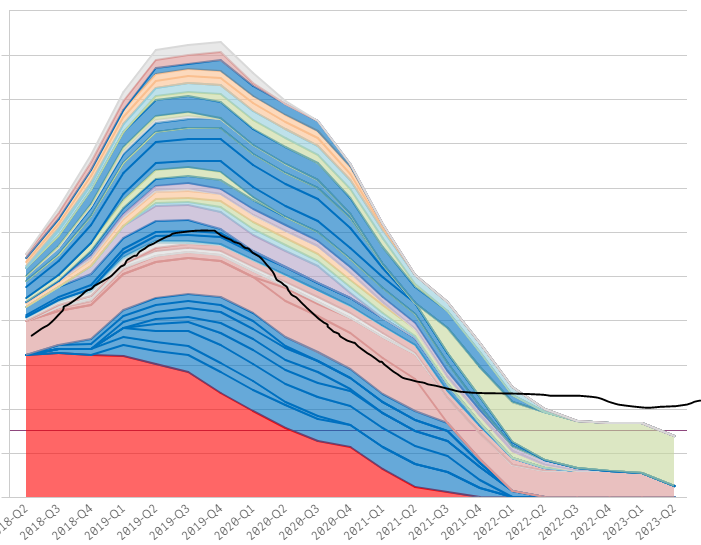
Any ideas how I can achieve this variable reference line ?
Many thanks,
Neale

 Ricardo_Gerhard
- Mark as New
- Bookmark
- Subscribe
- Mute
- Subscribe to RSS Feed
- Permalink
- Report Inappropriate Content
Dear Neale,
I guess that R will be help, but you will need to understand and build a prediction logic.
OEM Solution Architect
LATAM

 YoussefBelloum
- Mark as New
- Bookmark
- Subscribe
- Mute
- Subscribe to RSS Feed
- Permalink
- Report Inappropriate Content
Hi,
you can join your prediction field in your table and use it as a reference line