Unlock a world of possibilities! Login now and discover the exclusive benefits awaiting you.

- Qlik Community
- :
- Forums
- :
- Analytics & AI
- :
- Products & Topics
- :
- Visualization and Usability
- :
- Adding a background color to a pivot table
- Subscribe to RSS Feed
- Mark Topic as New
- Mark Topic as Read
- Float this Topic for Current User
- Bookmark
- Subscribe
- Mute
- Printer Friendly Page

 robin_heijt
- Mark as New
- Bookmark
- Subscribe
- Mute
- Subscribe to RSS Feed
- Permalink
- Report Inappropriate Content
Adding a background color to a pivot table
Hi,
I would like to know how to color the background of a straight table based on multiple conditions.
My data source is the following:
Dimension 1 = Year
Dimension 2 = Band
Measure = Total Population
My desired outcome:
if("year"='2011' and [Band Unified]='ALL', rgb(255, 0, 0),//Red
if("year"='2011' and [Band Unified]='VII', rgb(255, 0, 0),//Red
if("year"='2011' and [Band Unified]='VI', rgb(255, 0, 0),//Red
if("year"='2011' and [Band Unified]='V', rgb(255, 192, 0),//Orange
if("year"='2011' and [Band Unified]='IV', rgb(146, 208, 80),//Green
if("year"='2011' and [Band Unified]='III', rgb(91, 155, 213),//Blue
............
Using this expression the output is as followed:
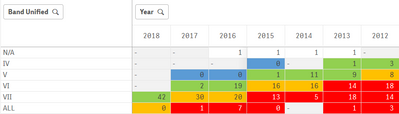
However now this also adds not existing null values.
Without the color expression, the table looks like this:
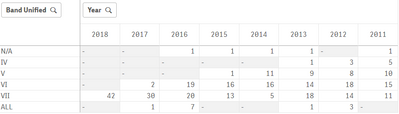
What do I need in my expression to show the colors in a proper way?
- Tags:
- color
- pivot table

 dplr-rn
- Mark as New
- Bookmark
- Subscribe
- Mute
- Subscribe to RSS Feed
- Permalink
- Report Inappropriate Content
robin_heijt
- Mark as New
- Bookmark
- Subscribe
- Mute
- Subscribe to RSS Feed
- Permalink
- Report Inappropriate Content
Thanks anyhow.
dplr-rn
- Mark as New
- Bookmark
- Subscribe
- Mute
- Subscribe to RSS Feed
- Permalink
- Report Inappropriate Content
