Unlock a world of possibilities! Login now and discover the exclusive benefits awaiting you.
Announcements
Qlik and ServiceNow Partner to Bring Trusted Enterprise Context into AI-Powered Workflows. Learn More!
- Qlik Community
- :
- Forums
- :
- Analytics & AI
- :
- Products & Topics
- :
- Visualization and Usability
- :
- Aggregate zero values in diagram in x-axis timelin...
Options
- Subscribe to RSS Feed
- Mark Topic as New
- Mark Topic as Read
- Float this Topic for Current User
- Bookmark
- Subscribe
- Mute
- Printer Friendly Page
Turn on suggestions
Auto-suggest helps you quickly narrow down your search results by suggesting possible matches as you type.
Showing results for
Contributor
2022-02-17
06:09 AM
- Mark as New
- Bookmark
- Subscribe
- Mute
- Subscribe to RSS Feed
- Permalink
- Report Inappropriate Content
Aggregate zero values in diagram in x-axis timeline
Hi all,
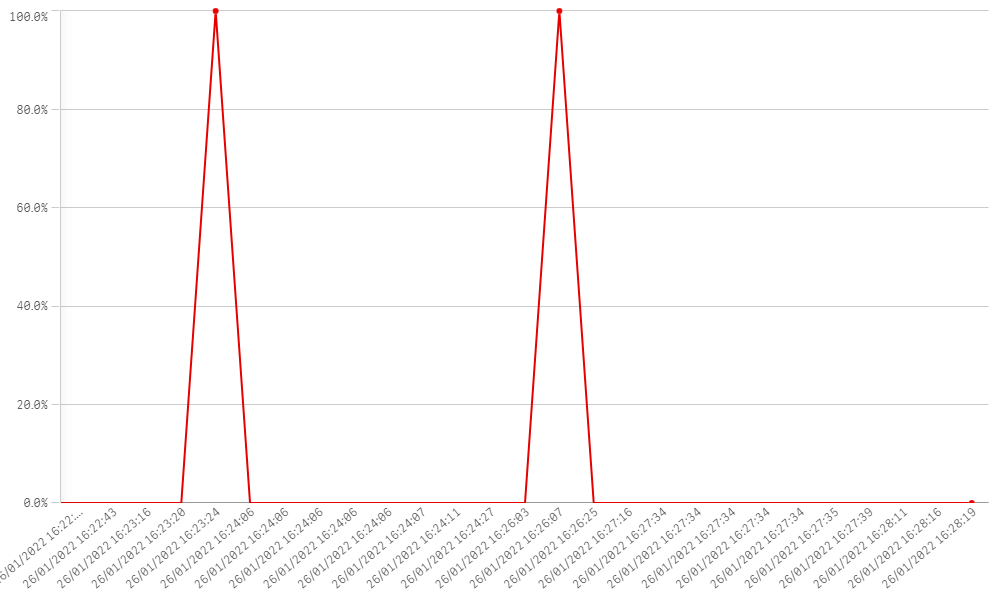
I have a diagram with
- x-axis --> date incl. time: '26/01/2021 11:22:56'
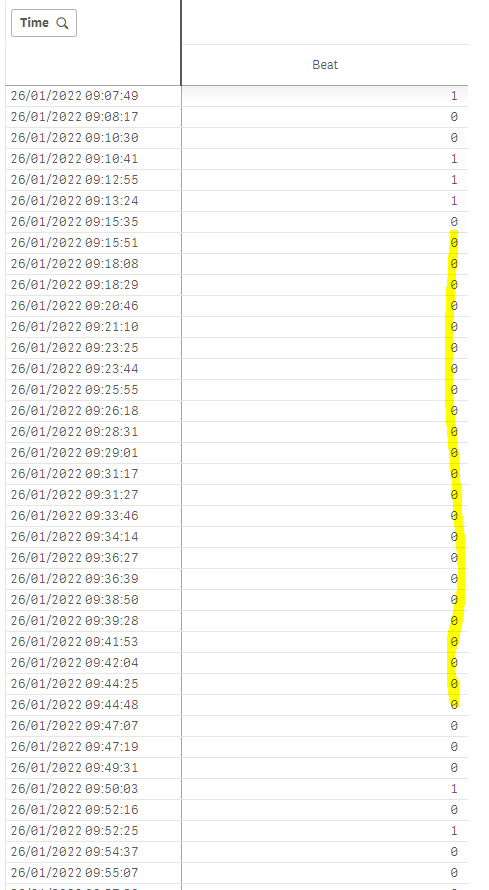
- y-axis --> calculated value of '0' or '1'
If I have 100 calculated zero values in a time row, I would like to aggregate the x-axis to the next jump from '0' to '1'. So I only show the jumps from 0 -->1 or 1 --> 0 . How can I do this?
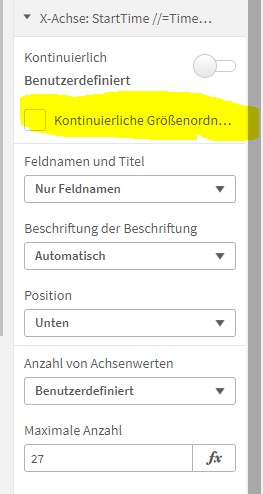
Unfortunately I cannot use any X-axis options (see snapshot) which already aggregate timeline because users would like to see the next date&time jump on the x-axis.
I attached some pictures.
thank you for help!
795 Views
0 Replies