Unlock a world of possibilities! Login now and discover the exclusive benefits awaiting you.
- Qlik Community
- :
- Forums
- :
- Analytics & AI
- :
- Products & Topics
- :
- Visualization and Usability
- :
- Aggregation over dimensions
- Subscribe to RSS Feed
- Mark Topic as New
- Mark Topic as Read
- Float this Topic for Current User
- Bookmark
- Subscribe
- Mute
- Printer Friendly Page
- Mark as New
- Bookmark
- Subscribe
- Mute
- Subscribe to RSS Feed
- Permalink
- Report Inappropriate Content
Aggregation over dimensions
Hello,
I'm new to qlik sense and I'm puzzled with this issue.
I have a table containing log records containing the time it took to complete an action and I'm building a performance report.
The table has following fields :
- Id (unique identifier for each request)
- Elapsed (time in miliseconds of the time it took to complete it)
- application
- region
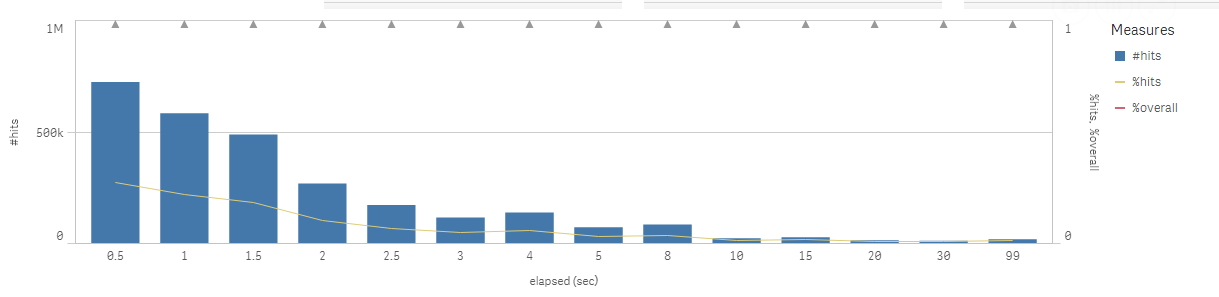
In order to be able to analyze and drill down i have a Combo Chart that shows data based on the loading time (in seconds).
The dimension is calculated with following formula :
=if(Elapsed<501,0.5, if(Elapsed<1001, 1, if(Elapsed<1501, 1.5, if(Elapsed<2001, 2, if(Elapsed<2501,2.5, if(Elapsed<3001,3, if(Elapsed<4001,4, if(Elapsed<5001, 5, if(Elapsed<8001, 8, if(Elapsed<10001, 10, if(Elapsed<15001,15, if(Elapsed<20001,20,if(Elapsed<30001,30, 99
)))))))))))))
Next I added the following measures :
-> Bar Chart : show the amount of hits for a dimension ==> count(Id)
-> Line chart : show the percentage of that dimension ==> Count(Id)/Count(Total Id)
So far so good :
In addition it seems logical to add an other line chart that would represent the overall % for that dimension.
| Dim | %hits | %Overall |
|---|---|---|
| 0.5 | 27.5% | 27.5% |
| 1 | 21.3% | 48.8% |
| 1.5 | 17.7% | 66.5% |
| 2 | 10.6% | 77.1% |
| 2.5 | 6.1% | 83.2% |
| ...... |
In the % overall-column I would expect this.
The formula I wanted to use is : =count(Total{<Elapsed={"<=Max($(Elapsed))"}>}Id)/count(Id)
How can I achieve this?
Thanks in advance!
Best Regards,
Steven