Unlock a world of possibilities! Login now and discover the exclusive benefits awaiting you.
- Qlik Community
- :
- Forums
- :
- Analytics & AI
- :
- Products & Topics
- :
- Visualization and Usability
- :
- Bar chart - control the width of the bars?
- Subscribe to RSS Feed
- Mark Topic as New
- Mark Topic as Read
- Float this Topic for Current User
- Bookmark
- Subscribe
- Mute
- Printer Friendly Page
- Mark as New
- Bookmark
- Subscribe
- Mute
- Subscribe to RSS Feed
- Permalink
- Report Inappropriate Content
Bar chart - control the width of the bars?
I have had several complaints from users of my apps because of bar charts. The issue is mainly due to the inconsistent width of the bars based on the number of values on the X-axis.
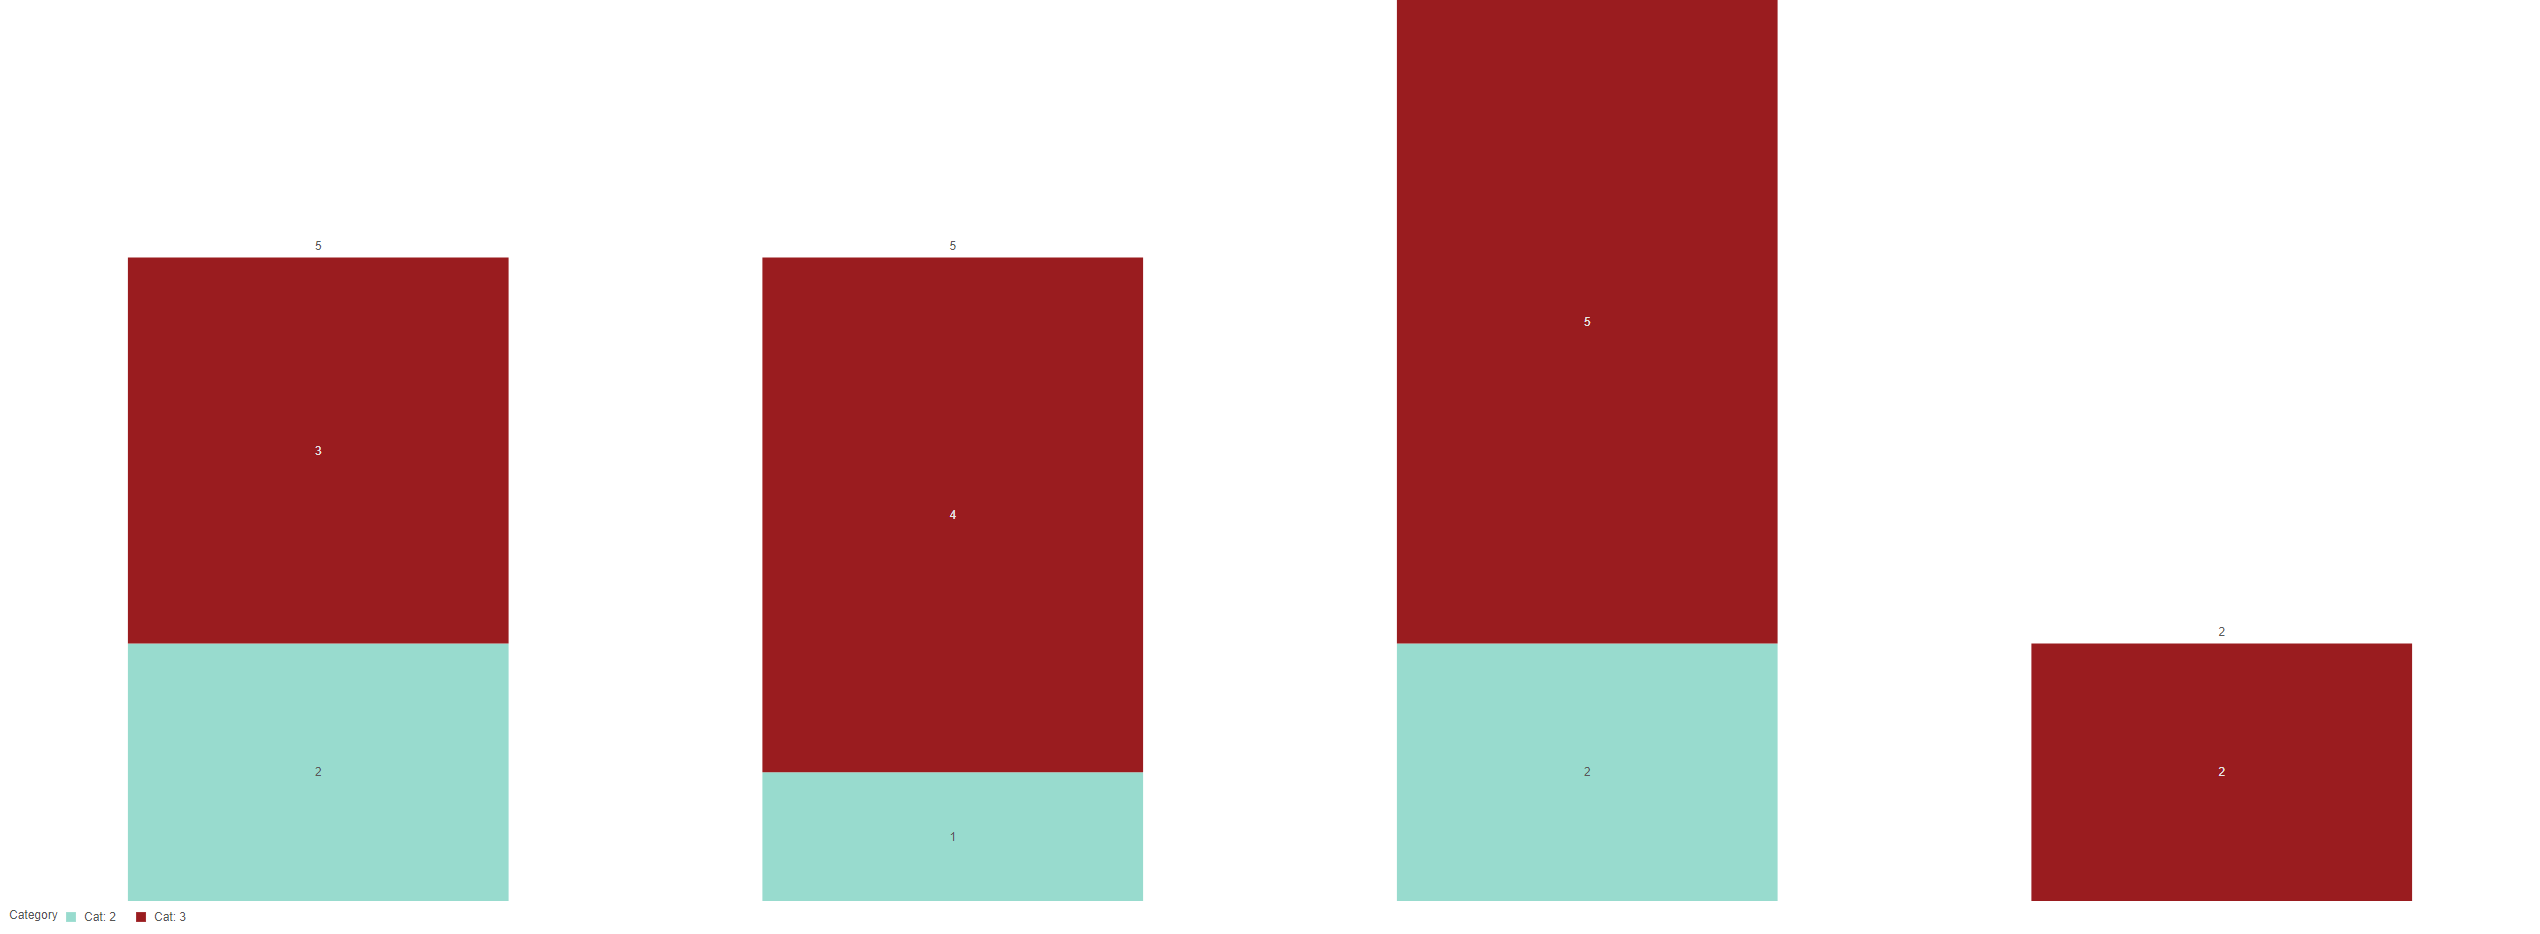
It looks really unprofessional during presentations when a user has to show two screenshots from the same chart but look completely different. You can see an example of the two screenshots attached.
Is it possible to control the width of the bars regardless of the number of values in the chart?
Thanks
- Mark as New
- Bookmark
- Subscribe
- Mute
- Subscribe to RSS Feed
- Permalink
- Report Inappropriate Content
There's a setting to control the width, but it deals with how much of the relative dimension space the bar takes up from a responsive point of view, not a fixed width. I don't think that's going to help with your issue.

I'm not aware of any way to prevent the bars from resizing based on the total available space. You could presumably "fix" this by forcing a specific number of members in the X dimension regardless of selections?
- Mark as New
- Bookmark
- Subscribe
- Mute
- Subscribe to RSS Feed
- Permalink
- Report Inappropriate Content
@Or Thanks for your reply.
Unfortunately, in my case the range of number of values can range from 40-50 values to as little as one bar only. Adjusting that setting only makes the bars relatively smaller or bigger, but the width still changes depending on the number of bars.
- Mark as New
- Bookmark
- Subscribe
- Mute
- Subscribe to RSS Feed
- Permalink
- Report Inappropriate Content
Then I don't think there's anything you can do other than generate dummy values in any case where the number is smaller than whatever fits on your screen before the scrollbar shows up. Note that this might also be achieved by showing dimension members with zero values, depending on what exactly your measures are doing.
If this is important to the users, they can export the data and generate their own charts in Excel or Google Sheets.
- Mark as New
- Bookmark
- Subscribe
- Mute
- Subscribe to RSS Feed
- Permalink
- Report Inappropriate Content
It's the intended behaviour and within the most scenarios quite suitable. But with some extra efforts it might be manipulated, for example: Controlling the width of bars in bar chart - Qlik Community - 1030065