Unlock a world of possibilities! Login now and discover the exclusive benefits awaiting you.
- Qlik Community
- :
- Forums
- :
- Analytics & AI
- :
- Products & Topics
- :
- Visualization and Usability
- :
- Bar chart required with filters
- Subscribe to RSS Feed
- Mark Topic as New
- Mark Topic as Read
- Float this Topic for Current User
- Bookmark
- Subscribe
- Mute
- Printer Friendly Page
- Mark as New
- Bookmark
- Subscribe
- Mute
- Subscribe to RSS Feed
- Permalink
- Report Inappropriate Content
Bar chart required with filters
I want to show that in a bar chart,
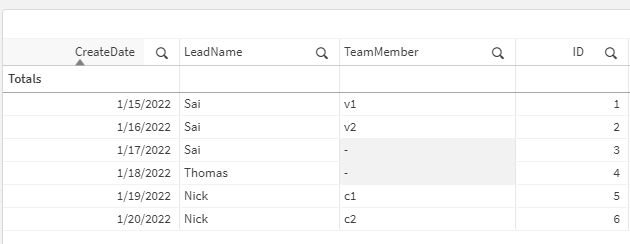
| create date | Lead name | team member | id |
| 1/15/2022 | Sai | v1 | 1 |
| 1/16/2022 | Sai | v2 | 2 |
| 1/17/2022 | Sai | - | 3 |
| 1/18/2022 | Thomas | 4 | |
| 1/19/2022 | Nick | c1 | 5 |
| 1/20/2022 | Nick | c2 | 6 |
create date as Dimension and measure as Count(ID) i want to see.
How many ID's are assigned to a "Lead name" which doesn't have "team members"?
results like :- id 4 is assigned to Thomas in 1/18/2022
in Bar chart i want to see all dates as dimension and measures (count (ID))will be coming on "1" in only 1/18/2022 dimension rest should come "0".
Thank you.
Accepted Solutions
- Mark as New
- Bookmark
- Subscribe
- Mute
- Subscribe to RSS Feed
- Permalink
- Report Inappropriate Content
Maybe this as expression:
=Count( {< [Lead name] ={"=Count([team member])<=1"} >} DISTINCT [Lead name] )

- Mark as New
- Bookmark
- Subscribe
- Mute
- Subscribe to RSS Feed
- Permalink
- Report Inappropriate Content
Hello,
The description is slightly confusing. You have mentioned that you want to count "How many ID's are assigned to a "Lead name" which doesn't have "team members"?" and you expect that the Bar chart will display: "will be coming on "1" in only 1/18/2022 dimension rest should come "0" ". However, according to your dataset, there are 2 different Lead names, that have an ID assigned without having an Team Member, and thus the Bar chart should show you 2 bars (One for 1/17/2022 and one for 1/28/2022). Unless of course for the Lead Name Sai, the "-" is not indicating a Null value.
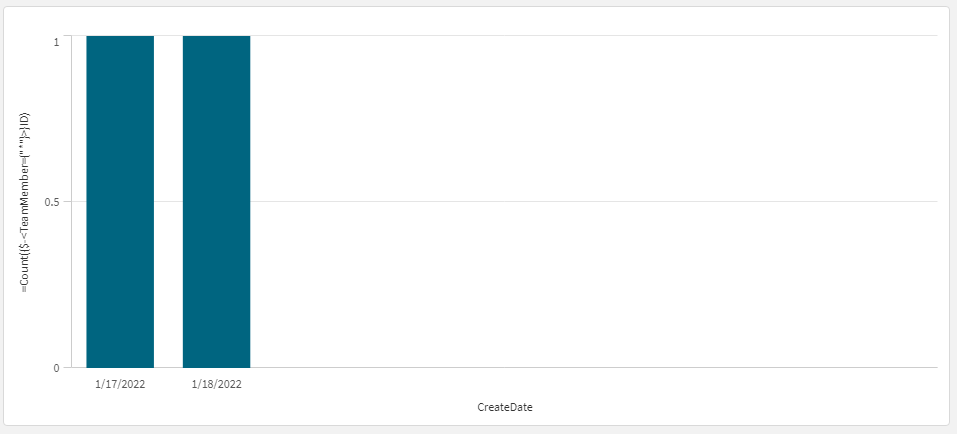
In any case, if what you need is to count all the IDs where Team Member is Null then you can create a Bar chart: with dimension "CreateDate" and as measure add the expression =Count({$-<TeamMember={"*"}>}ID). This will count all the TeamMembers that have data and subtract them from the total count so leaving you with the ones that are Null().
Dataset looks like this:
Outcome of the Bar chart looks like this:
I hope that this information was helpful. In case I have misunderstood the use case scenario, please elaborate in details by providing additional information. However, if it has helped you resolve the issue, please mark it as accepted solution to give further visibility to other community members.
- Mark as New
- Bookmark
- Subscribe
- Mute
- Subscribe to RSS Feed
- Permalink
- Report Inappropriate Content
we need to consider only "lead name" doesn't have any "team member".
I have to avoid that if 1 team member available in lead name column.
example:- we should not consider "Sai" because it have some team members available.
I hope this will clear the confusion.
thanks for your response
- Mark as New
- Bookmark
- Subscribe
- Mute
- Subscribe to RSS Feed
- Permalink
- Report Inappropriate Content
Maybe this as expression:
=Count( {< [Lead name] ={"=Count([team member])<=1"} >} DISTINCT [Lead name] )