Unlock a world of possibilities! Login now and discover the exclusive benefits awaiting you.

- Qlik Community
- :
- Forums
- :
- Analytics & AI
- :
- Products & Topics
- :
- Visualization and Usability
- :
- Calculate growth on previous year and current year
- Subscribe to RSS Feed
- Mark Topic as New
- Mark Topic as Read
- Float this Topic for Current User
- Bookmark
- Subscribe
- Mute
- Printer Friendly Page

 Rsaiq
Rsaiq
- Mark as New
- Bookmark
- Subscribe
- Mute
- Subscribe to RSS Feed
- Permalink
- Report Inappropriate Content
Calculate growth on previous year and current year
Hi All,
I am calculating growth previous year sales / current year sales
Below is my dataset
ID Year Sales
1 2022 100
2 2022 200
3 2022 300
4 2022 400
5 2022 500
6 2022 600
7 2022 700
1 2023 500
2 2023 50
3 2023 100
4 2023 400
5 2023 90
6 2023 10
7 2023 20
1 2024 200
2 2024 30
3 2024 1000
4 2024 250
5 2024 650
6 2024 310
7 2024 255
I have calculated the sales per year using group by function on year but i am not getting how can I get my desired output.
I followed below approach:
Main:
Load ID,
Year,
Sales
From
.............
GroupByYearData:
Load
Year,
Sum(Sales) as Amount_By_Year
Resident Main
Group by Year;
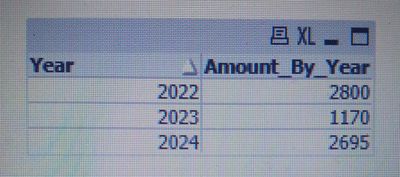
I have calculated Amount_By_Year but now I need to use this field to calculate growth per year.
Below is the Amount_By_Year snapshot
Now I want Growth as below
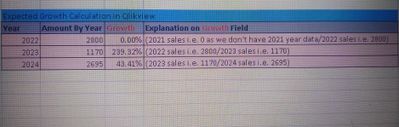
Please help me to get this to resolve.
Thanks in advance
- Tags:
- expression
Accepted Solutions

 QFabian
- Mark as New
- Bookmark
- Subscribe
- Mute
- Subscribe to RSS Feed
- Permalink
- Report Inappropriate Content
hope you LIKE it @Rsaiq !
no changes on script, just chart expression formula :
if(Dimensionality()=1, Sum(YearSalesGrowth), sum(MonthSalesGrowth))
Dimensionality
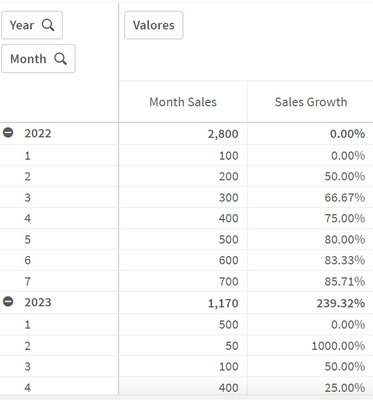
did it work for you? give like and mark the solution as accepted.
QFabian
- Mark as New
- Bookmark
- Subscribe
- Mute
- Subscribe to RSS Feed
- Permalink
- Report Inappropriate Content
Hi @Rsaiq , please check if this works for you. check that Year + 1 as Year, it enables to add the previous year sales to the table.
Script :
Data:
Load * INLINE [
ID, Year, Sales
1, 2022, 100
2, 2022, 200
3, 2022, 300
4, 2022, 400
5, 2022, 500
6, 2022, 600
7, 2022, 700
1, 2023, 500
2, 2023, 50
3, 2023, 100
4, 2023, 400
5, 2023, 90
6, 2023, 10
7, 2023, 20
1, 2024, 200
2, 2024, 30
3, 2024, 1000
4, 2024, 250
5, 2024, 650
6, 2024, 310
7, 2024, 255
];
YearSales:
Load
Year,
sum(Sales) as YearSales
Resident Data
Group By
Year;
left join
Load
Year + 1 as Year,
YearSales as PreviousYearSales
Resident YearSales;
YearSalesGrowth:
Load
Year,
YearSales,
PreviousYearSales,
PreviousYearSales / YearSales as YearSalesGrowth
Resident YearSales;
drop table YearSales;
exit script;
//The table chart, 3 dimensions one expression, for formmating the %
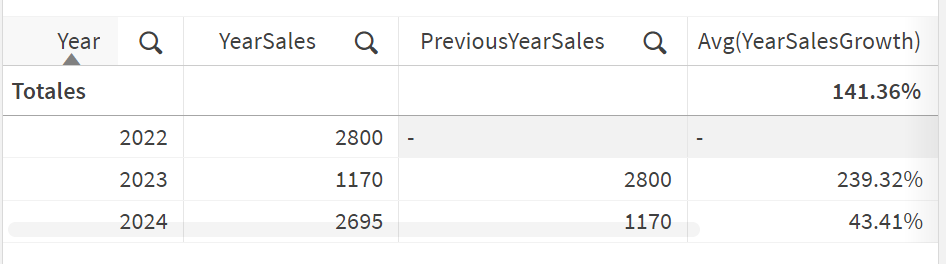
did it work for you? give like and mark the solution as accepted.
Rsaiq
- Mark as New
- Bookmark
- Subscribe
- Mute
- Subscribe to RSS Feed
- Permalink
- Report Inappropriate Content
Hi @QFabian ,
Thanks for your reply and solution..
It's working fine as per the year but in addition to that if we add another column as Month and use to show % on month wise too.
So added the new column as below
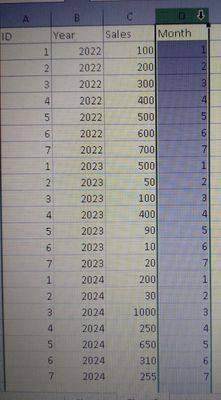
And tried to add in the table but its showing amount for the years with the months
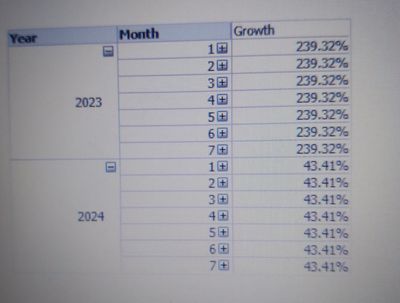
I need to show as per month wise too.
Could you please check this.
Thanks
QFabian
- Mark as New
- Bookmark
- Subscribe
- Mute
- Subscribe to RSS Feed
- Permalink
- Report Inappropriate Content
@Rsaiq , here you have the new script, it adds the month growth. It works with addmonths.so it is expecting every month year.
Data:
Load * INLINE [
ID, Year, Sales, Month
1, 2022, 100,1
2, 2022, 200,2
3, 2022, 300,3
4, 2022, 400,4
5, 2022, 500,5
6, 2022, 600,6
7, 2022, 700,7
1, 2023, 500,1
2, 2023, 50,2
3, 2023, 100,3
4, 2023, 400,4
5, 2023, 90,5
6, 2023, 10,6
7, 2023, 20,7
1, 2024, 200,1
2, 2024, 30,2
3, 2024, 1000,3
4, 2024, 250,4
5, 2024, 650,5
6, 2024, 310,6
7, 2024, 255,7
];
Data2:
Load
ID,
Year,
Month,
monthname(makedate(Year, Month)) as Period,
Sales
Resident Data;
drop table Data;
YearSales:
Load
Year,
sum(Sales) as YearSales
Resident Data2
Group By
Year;
left join
Load
Year + 1 as Year,
YearSales as PreviousYearSales
Resident YearSales;
YearSalesGrowth:
Load
Year,
YearSales,
PreviousYearSales,
PreviousYearSales / YearSales as YearSalesGrowth
Resident YearSales;
drop table YearSales;
MonthSales:
Load
Period,
sum(Sales) as MonthSales
Resident Data2
Group By
Period;
left join
Load
monthname(addmonths(Period, 1)) as Period,
MonthSales as PreviousMonthSales
Resident MonthSales;
MonthSalesGrowth:
Load
Period,
MonthSales,
PreviousMonthSales,
PreviousMonthSales / MonthSales as MonthSalesGrowth
Resident MonthSales;
drop table MonthSales;
exit script;
did it work for you? give like and mark the solution as accepted.
Rsaiq
- Mark as New
- Bookmark
- Subscribe
- Mute
- Subscribe to RSS Feed
- Permalink
- Report Inappropriate Content
Hi @QFabian ,
Thanks for your reply !!!
I might be annoying. Sorry for that.
Above script creating 2 calculated field as YearSalesGrowth & MonthSalesGrowth but I need this like pivoting .For example I am sharing here screenshot of Year,Month & Sales in pivot table
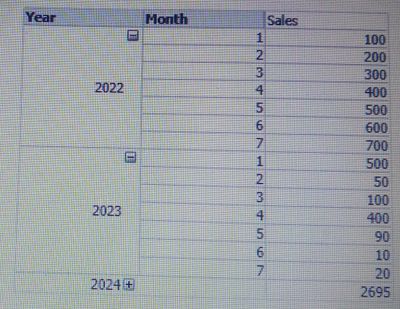
same like this I need Year,Month and Growth in pivot table and growth should work with both Year and Month.
Once again sorry if I am disturbing you.Thank You
QFabian
- Mark as New
- Bookmark
- Subscribe
- Mute
- Subscribe to RSS Feed
- Permalink
- Report Inappropriate Content
hope you LIKE it @Rsaiq !
no changes on script, just chart expression formula :
if(Dimensionality()=1, Sum(YearSalesGrowth), sum(MonthSalesGrowth))
Dimensionality
did it work for you? give like and mark the solution as accepted.
Rsaiq
- Mark as New
- Bookmark
- Subscribe
- Mute
- Subscribe to RSS Feed
- Permalink
- Report Inappropriate Content
