Unlock a world of possibilities! Login now and discover the exclusive benefits awaiting you.

- Qlik Community
- :
- Forums
- :
- Analytics & AI
- :
- Products & Topics
- :
- Visualization and Usability
- :
- Calculate measure based on row
- Subscribe to RSS Feed
- Mark Topic as New
- Mark Topic as Read
- Float this Topic for Current User
- Bookmark
- Subscribe
- Mute
- Printer Friendly Page

 jori
jori
- Mark as New
- Bookmark
- Subscribe
- Mute
- Subscribe to RSS Feed
- Permalink
- Report Inappropriate Content
Calculate measure based on row
I am trying to make a table with a calculated percentage. Problem is that the table rows are year > quarter > month > week, and the calculation depends on which timeframe it is.
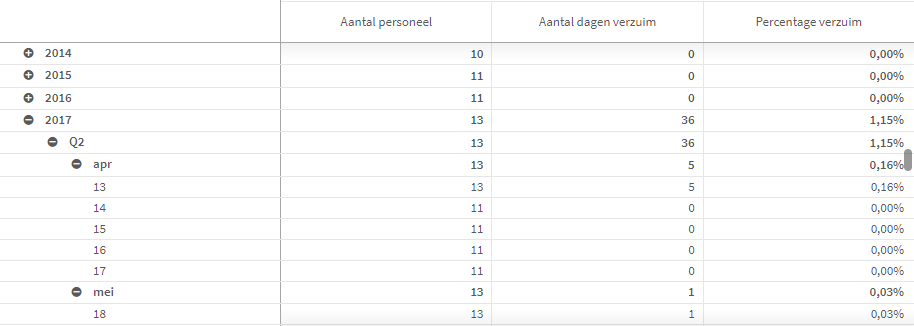
The calculation for "Percentage verzuim" now is:
(Sum([#dagenverzuim]) / (240 * Count(personeelnummer)))
What it does is calculate the percentage of sick leave. So 240 is the amount of working days in a year. So this calculation works fine as long as it's for a full year (I know that's not 100% correct, but it's for a school project so it's close enough). But how can I make sure it's also correct for the other timeframes?
Now I think/expect that this should be possible with a nested if statement. So if the first column has 4 numbers, it's a year so *240. If it has a Q it's a quarter so *60, etc. But I can't figure out how to do that in Qlik.
Accepted Solutions

 rwunderlich
- Mark as New
- Bookmark
- Subscribe
- Mute
- Subscribe to RSS Feed
- Permalink
- Report Inappropriate Content
What you are looking for here is "Dimensionality()" function. Dimensionality() will return the number of columns for the current row.
Using Dimensionality, you can do something like:
(Sum([#dagenverzuim]) / (Pick(Dimensionality(), 240, 60, 20, 5) * Count(personeelnummer)))
Another, more flexible -- and more accurate -- approach would be a to attach a "WorkingDay" flag to each working date in your calendar table (if you have one). Then
(Sum([#dagenverzuim]) / (Count(WorkingDay) * Count(personeelnummer)))
-Rob
http://www.easyqlik.com
http://masterssummit.com
http://qlikviewcookbook.com
rwunderlich
- Mark as New
- Bookmark
- Subscribe
- Mute
- Subscribe to RSS Feed
- Permalink
- Report Inappropriate Content
What you are looking for here is "Dimensionality()" function. Dimensionality() will return the number of columns for the current row.
Using Dimensionality, you can do something like:
(Sum([#dagenverzuim]) / (Pick(Dimensionality(), 240, 60, 20, 5) * Count(personeelnummer)))
Another, more flexible -- and more accurate -- approach would be a to attach a "WorkingDay" flag to each working date in your calendar table (if you have one). Then
(Sum([#dagenverzuim]) / (Count(WorkingDay) * Count(personeelnummer)))
-Rob
http://www.easyqlik.com
http://masterssummit.com
http://qlikviewcookbook.com
jori
- Mark as New
- Bookmark
- Subscribe
- Mute
- Subscribe to RSS Feed
- Permalink
- Report Inappropriate Content
Brilliant @rwunderlich ! I went the dimensionality route, works like an absolute charm!
