Unlock a world of possibilities! Login now and discover the exclusive benefits awaiting you.
- Qlik Community
- :
- Forums
- :
- Analytics & AI
- :
- Products & Topics
- :
- Visualization and Usability
- :
- Change Date Format in Forecast line
- Subscribe to RSS Feed
- Mark Topic as New
- Mark Topic as Read
- Float this Topic for Current User
- Bookmark
- Subscribe
- Mute
- Printer Friendly Page
- Mark as New
- Bookmark
- Subscribe
- Mute
- Subscribe to RSS Feed
- Permalink
- Report Inappropriate Content
Change Date Format in Forecast line
Hi,
I have a forecast line for a vizlib line chart.
The line chart displays cases closed in a month. Can I change the date format in the tooltip of the forecast line?
Thanks
Accepted Solutions
- Mark as New
- Bookmark
- Subscribe
- Mute
- Subscribe to RSS Feed
- Permalink
- Report Inappropriate Content
Hello,
If my understanding is correct, the Vizlib Line Chart is using the values that you have loaded into Qlik Sense. In that case, you can perhaps try formatting the values directly in Data load editor with the following example:
1. In Data load editor you can use the script:
LOAD
Date(Date, 'DD - MM - YYYY') as Date
FROM [...]
(...);
2. In Qlik Sense this will have the following outcome:
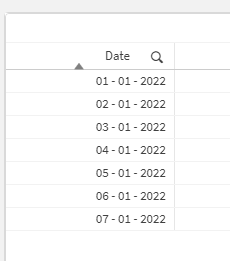
As you can see the dates are formatted as per your request.
3. Now, ideally, you can try using the date value in the Vizlib Line Chart to display.
4. If the value is still not displayed as you have loaded it within the Data load editor, it probably means that the visualization is not keeping the desired format and it is treating the value as timestamp. In that case, since this visualization is not an native visualization included in Qlik Sense and it was developed by different team, you will have to contact the team and ask them if your use case scenario is possible or check why the formatted value is not displayed as needed on the visualization.
I hope that this information was helpful. In case I have misunderstood the use case scenario, please elaborate in details by providing additional information. However, if it has helped you resolve the issue, please mark it as accepted solution to give further visibility to other community members.
- Mark as New
- Bookmark
- Subscribe
- Mute
- Subscribe to RSS Feed
- Permalink
- Report Inappropriate Content
Hello,
If my understanding is correct, the Vizlib Line Chart is using the values that you have loaded into Qlik Sense. In that case, you can perhaps try formatting the values directly in Data load editor with the following example:
1. In Data load editor you can use the script:
LOAD
Date(Date, 'DD - MM - YYYY') as Date
FROM [...]
(...);
2. In Qlik Sense this will have the following outcome:
As you can see the dates are formatted as per your request.
3. Now, ideally, you can try using the date value in the Vizlib Line Chart to display.
4. If the value is still not displayed as you have loaded it within the Data load editor, it probably means that the visualization is not keeping the desired format and it is treating the value as timestamp. In that case, since this visualization is not an native visualization included in Qlik Sense and it was developed by different team, you will have to contact the team and ask them if your use case scenario is possible or check why the formatted value is not displayed as needed on the visualization.
I hope that this information was helpful. In case I have misunderstood the use case scenario, please elaborate in details by providing additional information. However, if it has helped you resolve the issue, please mark it as accepted solution to give further visibility to other community members.