Unlock a world of possibilities! Login now and discover the exclusive benefits awaiting you.
- Qlik Community
- :
- Forums
- :
- Analytics
- :
- Topics
- :
- Visualization and Usability
- :
- Color Scheme in pivot table
- Subscribe to RSS Feed
- Mark Topic as New
- Mark Topic as Read
- Float this Topic for Current User
- Bookmark
- Subscribe
- Mute
- Printer Friendly Page
- Mark as New
- Bookmark
- Subscribe
- Mute
- Subscribe to RSS Feed
- Permalink
- Report Inappropriate Content
Color Scheme in pivot table
Hie,
I want to apply colors on a range in pivot table, I have used 1 dimension and 1 measure. In measure I have applied a condition where I want to see only outstanding more than 3L and used the following expression
(Sum({<Outstanding={'>=300000'}>}Outstanding)/100000)
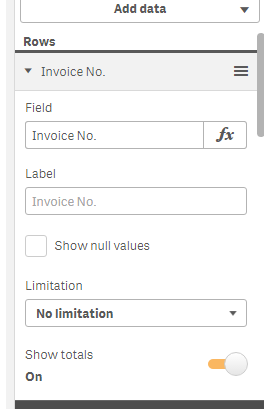
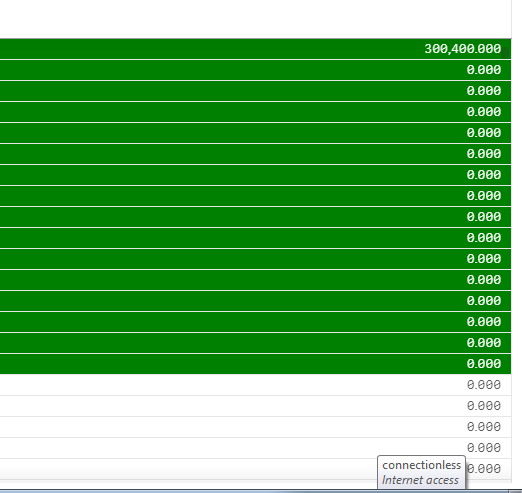
Now, I want background-color to each range i.e. 3l-5l: green 5l-8l:blue and 8L> red
but when i am appling the condition the values which are below 3l are also visible which i dont want.
I have used the following expression :
if(Outstanding>=300000 and Outstanding<=500000,Green(),
if( Outstanding>500000 and Outstanding<=800000,Blue(),
if(Outstanding>800000 ,red(),Null())))
Please help me out with this.
Thank you
- Mark as New
- Bookmark
- Subscribe
- Mute
- Subscribe to RSS Feed
- Permalink
- Report Inappropriate Content
On the dimension have you ticked the exclude null values?
- Mark as New
- Bookmark
- Subscribe
- Mute
- Subscribe to RSS Feed
- Permalink
- Report Inappropriate Content
yes, I have unchecked the show null values.
however when I not using the background- color at that time the values displayed are only above 3L
and when I am using the color condition at that time all the vles are displayed