Unlock a world of possibilities! Login now and discover the exclusive benefits awaiting you.

- Qlik Community
- :
- Forums
- :
- Analytics & AI
- :
- Products & Topics
- :
- Visualization and Usability
- :
- Color coding grouped bar chart
- Subscribe to RSS Feed
- Mark Topic as New
- Mark Topic as Read
- Float this Topic for Current User
- Bookmark
- Subscribe
- Mute
- Printer Friendly Page

 guruprem
- Mark as New
- Bookmark
- Subscribe
- Mute
- Subscribe to RSS Feed
- Permalink
- Report Inappropriate Content
Color coding grouped bar chart
Hi,
I visualized 3 measures in a grouped bar char. I want give a dedicated color to each measure. Please help in achieving it in Qlik Sense?
My 3 measures are MTN-Score, Airtel Score and Vodafone Score. And chart looks like below
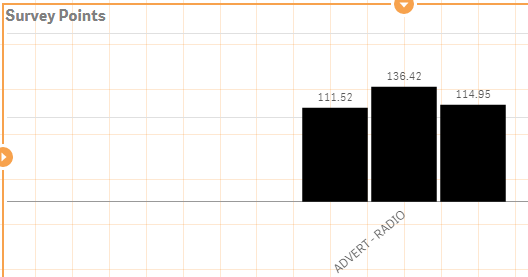
Note: Normal color expression such as ( IF brand = MTN , Red() 0 is not working
Accepted Solutions

- Mark as New
- Bookmark
- Subscribe
- Mute
- Subscribe to RSS Feed
- Permalink
- Report Inappropriate Content
- Mark as New
- Bookmark
- Subscribe
- Mute
- Subscribe to RSS Feed
- Permalink
- Report Inappropriate Content
guruprem
- Mark as New
- Bookmark
- Subscribe
- Mute
- Subscribe to RSS Feed
- Permalink
- Report Inappropriate Content
Following link perfectly solved the scenario. However I would be happy if there is any simpler method without using valuelist.
Qlik Sense: How to set custom colors by measure in a bar chart

 reddy-s
- Mark as New
- Bookmark
- Subscribe
- Mute
- Subscribe to RSS Feed
- Permalink
- Report Inappropriate Content
Hi Guruprem,
Apart from using a value list you only have an other option. Load an inline table in the data load editor and add that as a second dimension in the bar chart.