Unlock a world of possibilities! Login now and discover the exclusive benefits awaiting you.
- Qlik Community
- :
- Forums
- :
- Analytics & AI
- :
- Products & Topics
- :
- Visualization and Usability
- :
- Comparing data between years
- Subscribe to RSS Feed
- Mark Topic as New
- Mark Topic as Read
- Float this Topic for Current User
- Bookmark
- Subscribe
- Mute
- Printer Friendly Page
- Mark as New
- Bookmark
- Subscribe
- Mute
- Subscribe to RSS Feed
- Permalink
- Report Inappropriate Content
Comparing data between years
I currently have my data of sales set out in a spreadsheet as below:
| Year | Actual Sales | Sales Target | Month |
|---|---|---|---|
| 2013/14 | ££££ | ££££ | 1 |
| 2013/14 | ££££ | ££££ | 2 |
| 2014/15 | ££££ | ££££ | 1 |
| 2014/15 | ££££ | ££££ | 2 |
I want to show the data as a gauge and so how would I write the expression that would compare sales between one year and the next?
Thanks
- Mark as New
- Bookmark
- Subscribe
- Mute
- Subscribe to RSS Feed
- Permalink
- Report Inappropriate Content
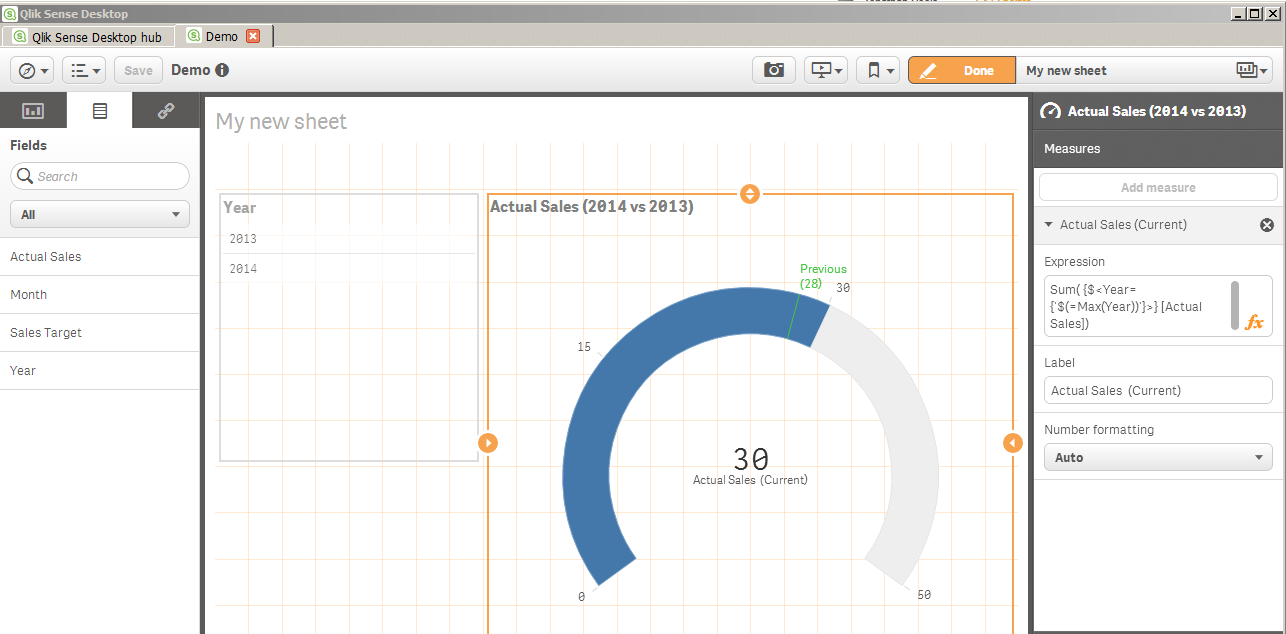
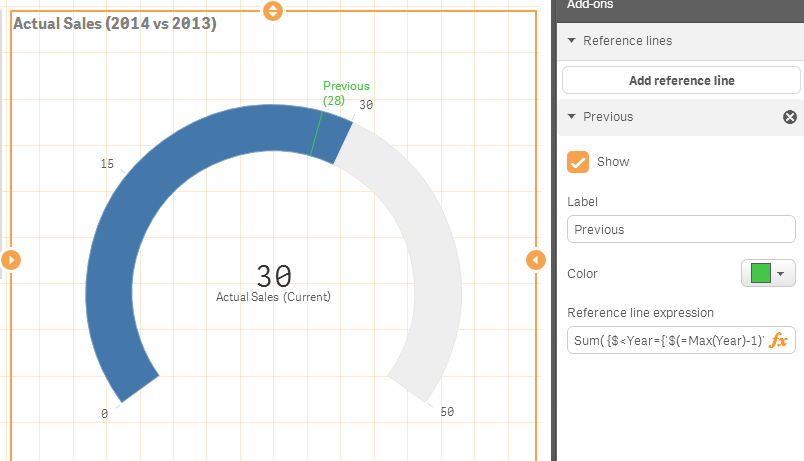
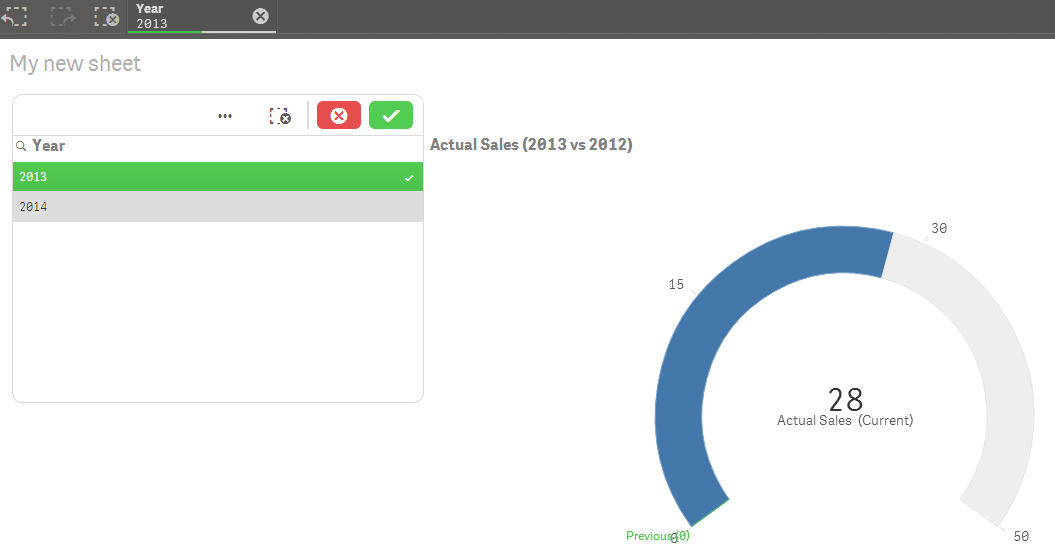
Here is a sample using SET ANALYSIS to dynamically calculate the most recent year in the user's selection and show that year's actual sales as the needle in the gauge while adding a green reference line to denote the previous years actual sales
Also attached is the QVF for your inspection. Just put it in your My Documents\qlik\sense\apps directory to see it in the destkop hub.
Note that on load i parsed your Year values to just show the first four characters ( ex: 2013/14 -> 2013) . That made it easy to calculate the most recent year in the user's selection (ie: max(year) and previous year (ie : max(year)-1) .
You can load both year formats and use a different field name for each if you want .
hope it helps