Unlock a world of possibilities! Login now and discover the exclusive benefits awaiting you.
- Qlik Community
- :
- Forums
- :
- Analytics & AI
- :
- Products & Topics
- :
- Visualization and Usability
- :
- Complex Bar Chart
- Subscribe to RSS Feed
- Mark Topic as New
- Mark Topic as Read
- Float this Topic for Current User
- Bookmark
- Subscribe
- Mute
- Printer Friendly Page
- Mark as New
- Bookmark
- Subscribe
- Mute
- Subscribe to RSS Feed
- Permalink
- Report Inappropriate Content
Complex Bar Chart
Hello community,
I am working on a controlling project (plan-is-validation in a logistic environment) which should lead to a new front-end tool. The goal is, to validate if all ordered items arrived on time, or if some of them do not meet the agreement.
A sample data set is in the attachment and this is my code....
LOAD
ID as ID,
SYS_ID as SYS_IDx,
FLOW_DES as FLOW_DESx,
MP as MPx,
NEEDED_DATE_TIME as NEEDED_DATE_TIMEx//,
//FM_INP_DATE as FM_INP_DATEx
FROM [lib://Documents/Logistic_Data_2.txt]
(txt, codepage is 28592, embedded labels, delimiter is '\t', msq)
where FLOW_DES = 'M' and SYS_ID = 'PDA' and MP = '80';
Inner Join
LOAD
ID as ID,
SYS_ID as SYS_IDy,
FLOW_DES as FLOW_DESy,
MP as MPy,
//NEEDED_DATE_TIME as NEEDED_DATE_TIMEy,
FM_INP_DATE as FM_INP_DATEy,
Date(FM_INP_DATE) as Date
FROM [lib://Documents/Logistic_Data_2.txt]
(txt, codepage is 28592, embedded labels, delimiter is '\t', msq)
where FLOW_DES = 'M' and SYS_ID = 'PDA' and MP = '110';
I created a filter-window to select the reference data / the on-time date, to which the items should arrived (which is always a day in the past and at least three or four days old).
After this, I created a bar chart, which contains the days in which the items arrived.
In this chart I can already see if an item arrived on time (for example on 8th of May) or to a later (e.g. 11th of May) or earlier (e.g. 7th of May) date in time.
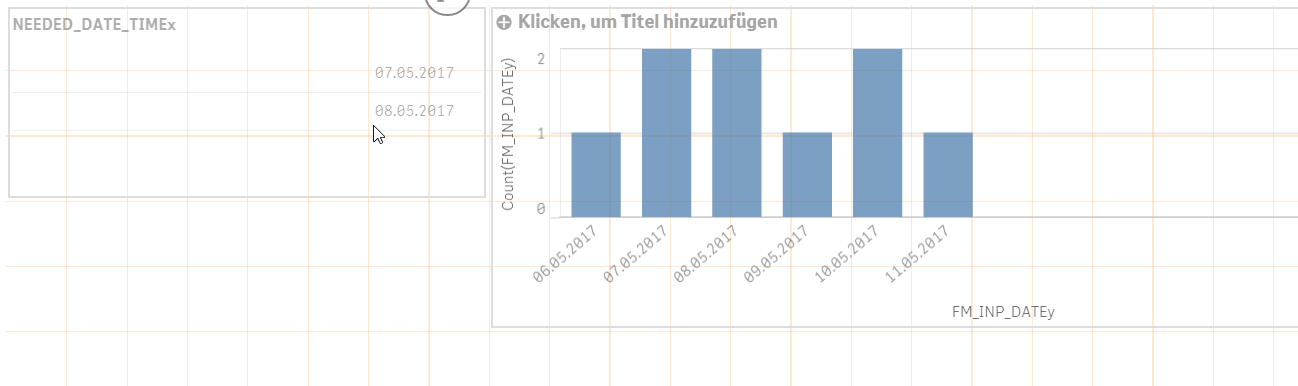
So I have all needed information in a nice an d simple chart.
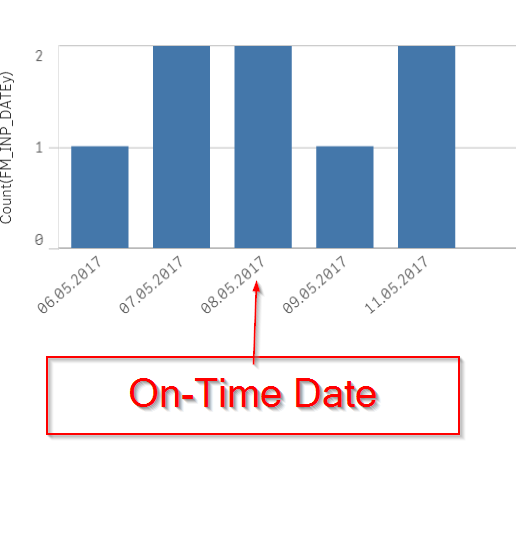
Unfortunately, this is not good enough for our end user :-(. They want to have a bar chart that shows the on-time date and also exactly two days in front of the one-time date and two days after. The bar chart should look like this (one way or another...).
I have absolutely no idea how this works. Is it even possible to do such thing with sense or do I need View (which I do not have…)
It would be very helpful if some of you can solve my problem.
Many thanks in advance!
P.S. If you have questions, feel free to ask.
- Mark as New
- Bookmark
- Subscribe
- Mute
- Subscribe to RSS Feed
- Permalink
- Report Inappropriate Content
You can modify your count expression to include a set expression like this:
Count( {1<Date={">=$(=Date(Date-2))<=$(=Date(Date+2))"}>} FM_INP_DATEy)
This will only display the chart with bars if and only if there is one selected date.