Unlock a world of possibilities! Login now and discover the exclusive benefits awaiting you.
- Qlik Community
- :
- Forums
- :
- Analytics & AI
- :
- Products & Topics
- :
- Visualization and Usability
- :
- Count - class
- Subscribe to RSS Feed
- Mark Topic as New
- Mark Topic as Read
- Float this Topic for Current User
- Bookmark
- Subscribe
- Mute
- Printer Friendly Page
- Mark as New
- Bookmark
- Subscribe
- Mute
- Subscribe to RSS Feed
- Permalink
- Report Inappropriate Content
Count - class
Hello ,
I calculated the number of transport calls for each transport reference.
Then I classified them by number of calls in intervals of 5.
Now I want to calculate how many transport reference I have with a call, 2, 3 .......... max (number call)
Can anyone help me
thank you in advance

Accepted Solutions
- Mark as New
- Bookmark
- Subscribe
- Mute
- Subscribe to RSS Feed
- Permalink
- Report Inappropriate Content
When you say it does not work, what does it return and why do you feel it is invalid?
The expression aggr(count([transport Call]), [transport reference]) will return a count for each [transport reference] and since it is used as a dimension (in a bar chart), it will group all like values together. Note that if there is a number, such as 1 and there are no [transport reference] with a count of 1 call, that value will not be displayed.
The expression count(distinct [transport reference]), when used with the above dimension, will give you a count to the [transport reference] associated with that number.
- Mark as New
- Bookmark
- Subscribe
- Mute
- Subscribe to RSS Feed
- Permalink
- Report Inappropriate Content
I may need more information, but I think you could use something like the following as a dimension:
aggr(count([transport Call]), [transport reference])
And, as your measure, use:
count(distinct [transport reference])
- Mark as New
- Bookmark
- Subscribe
- Mute
- Subscribe to RSS Feed
- Permalink
- Report Inappropriate Content
This solution did not work,
I want to calculated how many transport reference with 1 call, 2, 3 ... etc and present them as a bar diagram. I don't know if I explained my need well
- Mark as New
- Bookmark
- Subscribe
- Mute
- Subscribe to RSS Feed
- Permalink
- Report Inappropriate Content
When you say it does not work, what does it return and why do you feel it is invalid?
The expression aggr(count([transport Call]), [transport reference]) will return a count for each [transport reference] and since it is used as a dimension (in a bar chart), it will group all like values together. Note that if there is a number, such as 1 and there are no [transport reference] with a count of 1 call, that value will not be displayed.
The expression count(distinct [transport reference]), when used with the above dimension, will give you a count to the [transport reference] associated with that number.
- Mark as New
- Bookmark
- Subscribe
- Mute
- Subscribe to RSS Feed
- Permalink
- Report Inappropriate Content
I understood that well!
but the graph displays nothing
- Mark as New
- Bookmark
- Subscribe
- Mute
- Subscribe to RSS Feed
- Permalink
- Report Inappropriate Content
Did you replace the field names with the correct names? I didn't know the exact fields names for the expressions I posted. Are they orange in the expression editor? I tested these formulas in similar data on my end and it returns the anticipated bar chart.
Can you post a sample qvf?
- Mark as New
- Bookmark
- Subscribe
- Mute
- Subscribe to RSS Feed
- Permalink
- Report Inappropriate Content
I changed the parameters with the right ones
how to get a qvf sample, i'm new to Qlik and i'm on saas
- Mark as New
- Bookmark
- Subscribe
- Mute
- Subscribe to RSS Feed
- Permalink
- Report Inappropriate Content
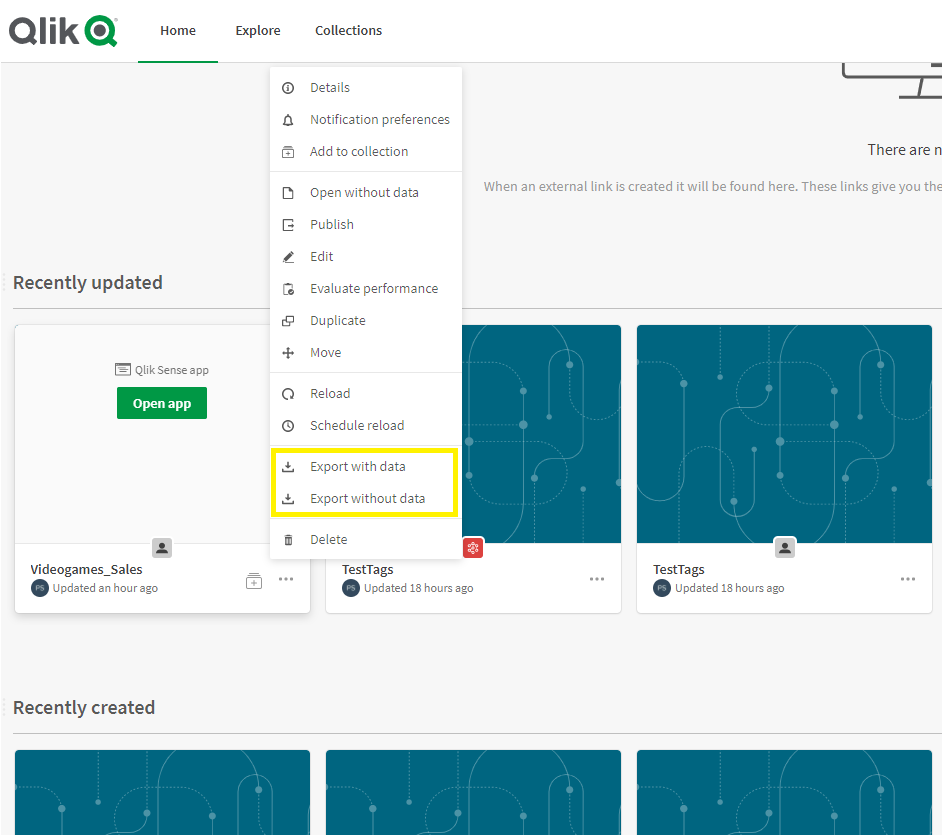
Hello GeosoftRim, you can download an app from here: