Unlock a world of possibilities! Login now and discover the exclusive benefits awaiting you.
- Qlik Community
- :
- Forums
- :
- Analytics
- :
- Topics
- :
- Visualization and Usability
- :
- Counting swabs taked in two hourly blocks throuout...
- Subscribe to RSS Feed
- Mark Topic as New
- Mark Topic as Read
- Float this Topic for Current User
- Bookmark
- Subscribe
- Mute
- Printer Friendly Page
- Mark as New
- Bookmark
- Subscribe
- Mute
- Subscribe to RSS Feed
- Permalink
- Report Inappropriate Content
Counting swabs taked in two hourly blocks throuout the day
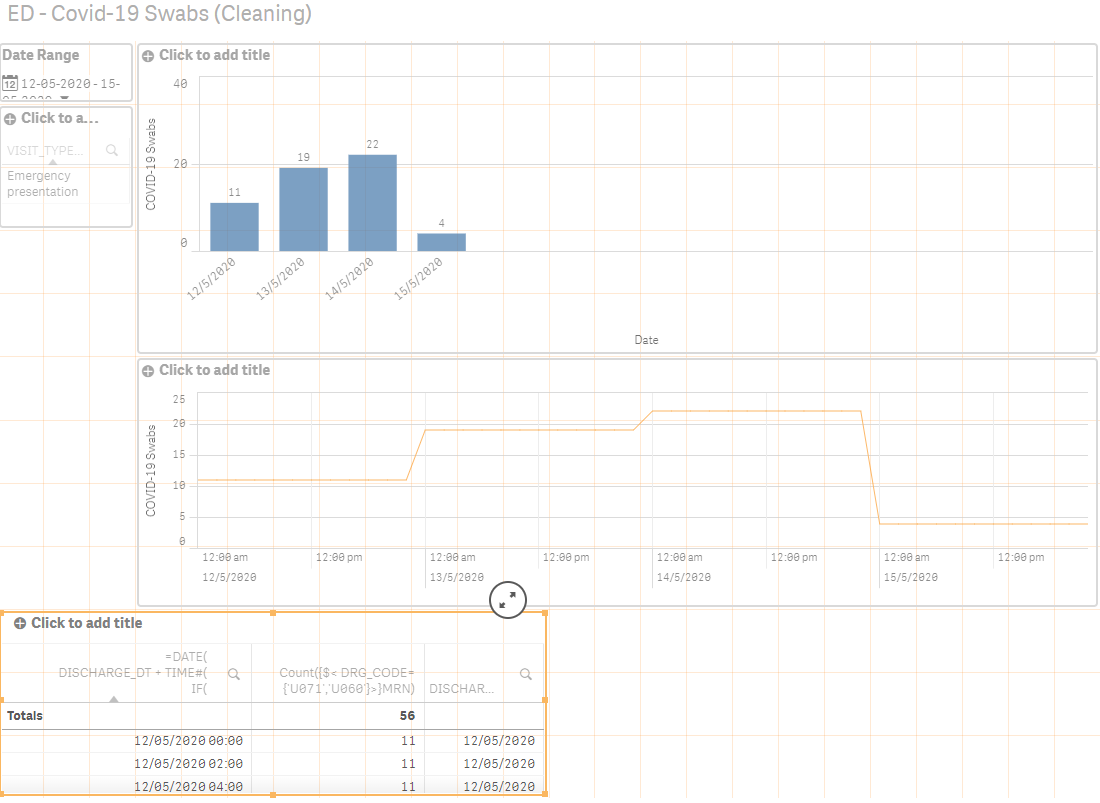
I Have started a session in Qlik as attached (cleaning) except the 2nd graph and table is not doing what I want.
I need to show in the graph how many swabs were done in a two hourly block throughout the day. ( see discharge_dt in table) I have used Count({$<DRG_CODE={'U071', 'U060'}>MRN) to count the number of swabs done per day ( graph 1)
but for the 12/5/2020 where 11 swabs were taken and shows in the cleaning file below , there times taken are as follows please see two hour blocks below. So this should reflect in graph 2 and in the table as well.
Not sure if the" count if" would work?? or there is a better solution??
Sorry really new at this!
thanks for your help.
- Mark as New
- Bookmark
- Subscribe
- Mute
- Subscribe to RSS Feed
- Permalink
- Report Inappropriate Content
Are you looking something like this?
tab1:
LOAD *, Time(Frac(Timestamp#([DISCHARGE DTTM],'M/D/YYYY hh:mm')),'hh:mm') As [DISCHARGE TIME];
LOAD * INLINE [
    DISCHARGE DTTM
    5/12/2020 14:55
    5/12/2020 11:23
    5/12/2020 12:48
    5/12/2020 11:29
    5/12/2020 11:07
    5/12/2020 12:55
    5/12/2020 11:51
    5/12/2020 13:51
    5/12/2020 11:22
    5/12/2020 11:42
    5/12/2020 11:42
];

HrsBucket:
LOAD Time((IterNo()-1)*2/24+1/1440,'hh:mm') As Start
	 ,Time((IterNo()*2/24),'hh:mm') As End
	 ,Time((IterNo()-1)*2/24+1/1440,'hh:mm')&' - '&Time((IterNo()*2/24),'hh:mm') As HrsBucket
AutoGenerate 1
While IterNo()<=12
;

Inner Join IntervalMatch([DISCHARGE TIME])
LOAD Start, End
Resident HrsBucket;- Mark as New
- Bookmark
- Subscribe
- Mute
- Subscribe to RSS Feed
- Permalink
- Report Inappropriate Content
Output.

- Mark as New
- Bookmark
- Subscribe
- Mute
- Subscribe to RSS Feed
- Permalink
- Report Inappropriate Content
Thanks for getting back to me.
I sorry but being new I am getting a bit confused, for the date I have attached what I have got, i thought you would need to count the DRG code not on the date??
Have I zigged when i should have zagged??