Unlock a world of possibilities! Login now and discover the exclusive benefits awaiting you.

- Qlik Community
- :
- Forums
- :
- Analytics & AI
- :
- Products & Topics
- :
- Visualization and Usability
- :
- Re: Create a filter based on excel columns
- Subscribe to RSS Feed
- Mark Topic as New
- Mark Topic as Read
- Float this Topic for Current User
- Bookmark
- Subscribe
- Mute
- Printer Friendly Page

 rittermd
- Mark as New
- Bookmark
- Subscribe
- Mute
- Subscribe to RSS Feed
- Permalink
- Report Inappropriate Content
Create a filter based on excel columns
My data source in an excel spreadsheet. Each row is a Branch. Each column is a year (2010 - 2016).
I have loaded the data into a table and I want the user to be able to pick a year and limit the data that is visible. I am not sure if or how I can do this with excel.
2010 2011 2012 2013 2014 etc.
Branch A 100 200 300 500 700
Accepted Solutions

 OmarBenSalem
- Mark as New
- Bookmark
- Subscribe
- Mute
- Subscribe to RSS Feed
- Permalink
- Report Inappropriate Content
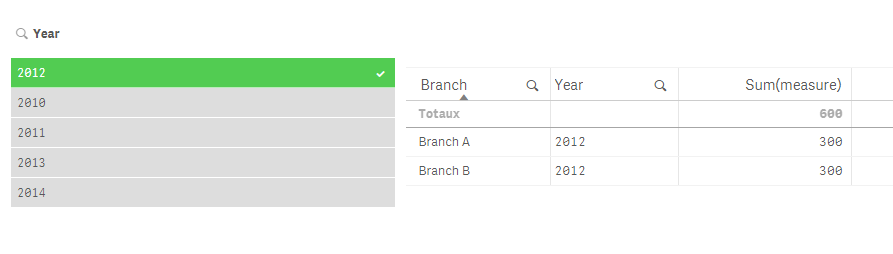
You use crosstable:
Crosstable (Year, measure, 1) LOAD * INLINE [
Branch, 2010, 2011, 2012, 2013, 2014
Branch A, 100 , 200, 300, 500, 700
Branch B, 200 , 400, 300, 700, 900
];
result:
OmarBenSalem
- Mark as New
- Bookmark
- Subscribe
- Mute
- Subscribe to RSS Feed
- Permalink
- Report Inappropriate Content
You use crosstable:
Crosstable (Year, measure, 1) LOAD * INLINE [
Branch, 2010, 2011, 2012, 2013, 2014
Branch A, 100 , 200, 300, 500, 700
Branch B, 200 , 400, 300, 700, 900
];
result:

 luohda
- Mark as New
- Bookmark
- Subscribe
- Mute
- Subscribe to RSS Feed
- Permalink
- Report Inappropriate Content
I have the same problem, currently i am using cross table, but what if I want to plot values of 2 different years in scatter plot? how can I select values of 2 different years as x and y? Or should I use another method instead of cross table? Because in some sheets I also want to filter years.
