Unlock a world of possibilities! Login now and discover the exclusive benefits awaiting you.

- Qlik Community
- :
- Forums
- :
- Analytics & AI
- :
- Products & Topics
- :
- Visualization and Usability
- :
- Creating a stacked bar chart in Qlik Sense.
- Subscribe to RSS Feed
- Mark Topic as New
- Mark Topic as Read
- Float this Topic for Current User
- Bookmark
- Subscribe
- Mute
- Printer Friendly Page

 chanin7893
- Mark as New
- Bookmark
- Subscribe
- Mute
- Subscribe to RSS Feed
- Permalink
- Report Inappropriate Content
Creating a stacked bar chart in Qlik Sense.
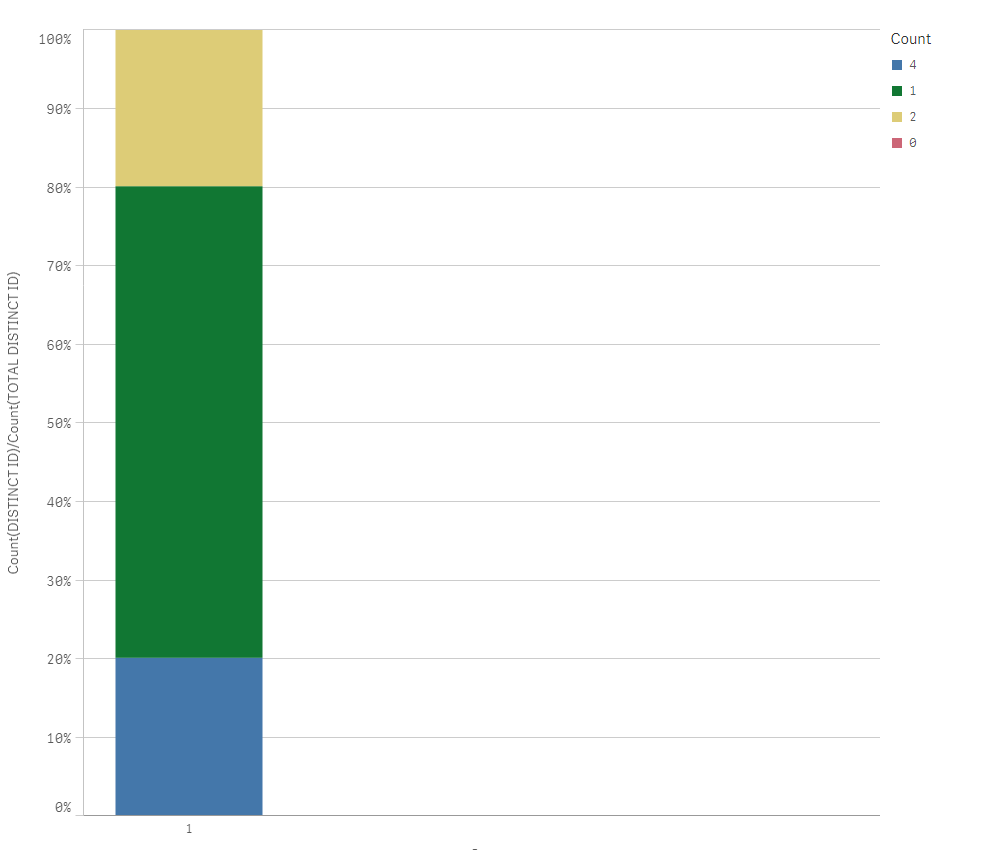
Suppose a number of calls have been made from different people. Same people can call multiple times as well. I want to know the percent (%) of people calling once, calling twice, calling 3 times and calling four or more times in a single stacked bar chart in Qlik Sense.
Eg: if 1 person (say 'A') calls once,
1 person (say 'B') calls twice
1 person (say 'C') calls 3 times
2 people (say 'D' & 'E') calls 4 times each
Then the stacked bar chart should look like
Once- 20%,Twice-20%, 3 Times- 20%, 4 Times- 40%
I have attached a test Excel sheet below (Where ID= Customer ID making Calls)
And a sample 'Stacked Bar Graph' result image..png)
Accepted Solutions

 sunny_talwar
- Mark as New
- Bookmark
- Subscribe
- Mute
- Subscribe to RSS Feed
- Permalink
- Report Inappropriate Content

 lakshmikandh
- Mark as New
- Bookmark
- Subscribe
- Mute
- Subscribe to RSS Feed
- Permalink
- Report Inappropriate Content
sunny_talwar
- Mark as New
- Bookmark
- Subscribe
- Mute
- Subscribe to RSS Feed
- Permalink
- Report Inappropriate Content
Something like this?
chanin7893
- Mark as New
- Bookmark
- Subscribe
- Mute
- Subscribe to RSS Feed
- Permalink
- Report Inappropriate Content
Thanks a lot .. It worked perfectly.. Cheers
