Unlock a world of possibilities! Login now and discover the exclusive benefits awaiting you.
- Qlik Community
- :
- Forums
- :
- Analytics & AI
- :
- Products & Topics
- :
- Visualization and Usability
- :
- Creating manual data points in combo chart?
- Subscribe to RSS Feed
- Mark Topic as New
- Mark Topic as Read
- Float this Topic for Current User
- Bookmark
- Subscribe
- Mute
- Printer Friendly Page
- Mark as New
- Bookmark
- Subscribe
- Mute
- Subscribe to RSS Feed
- Permalink
- Report Inappropriate Content
Creating manual data points in combo chart?
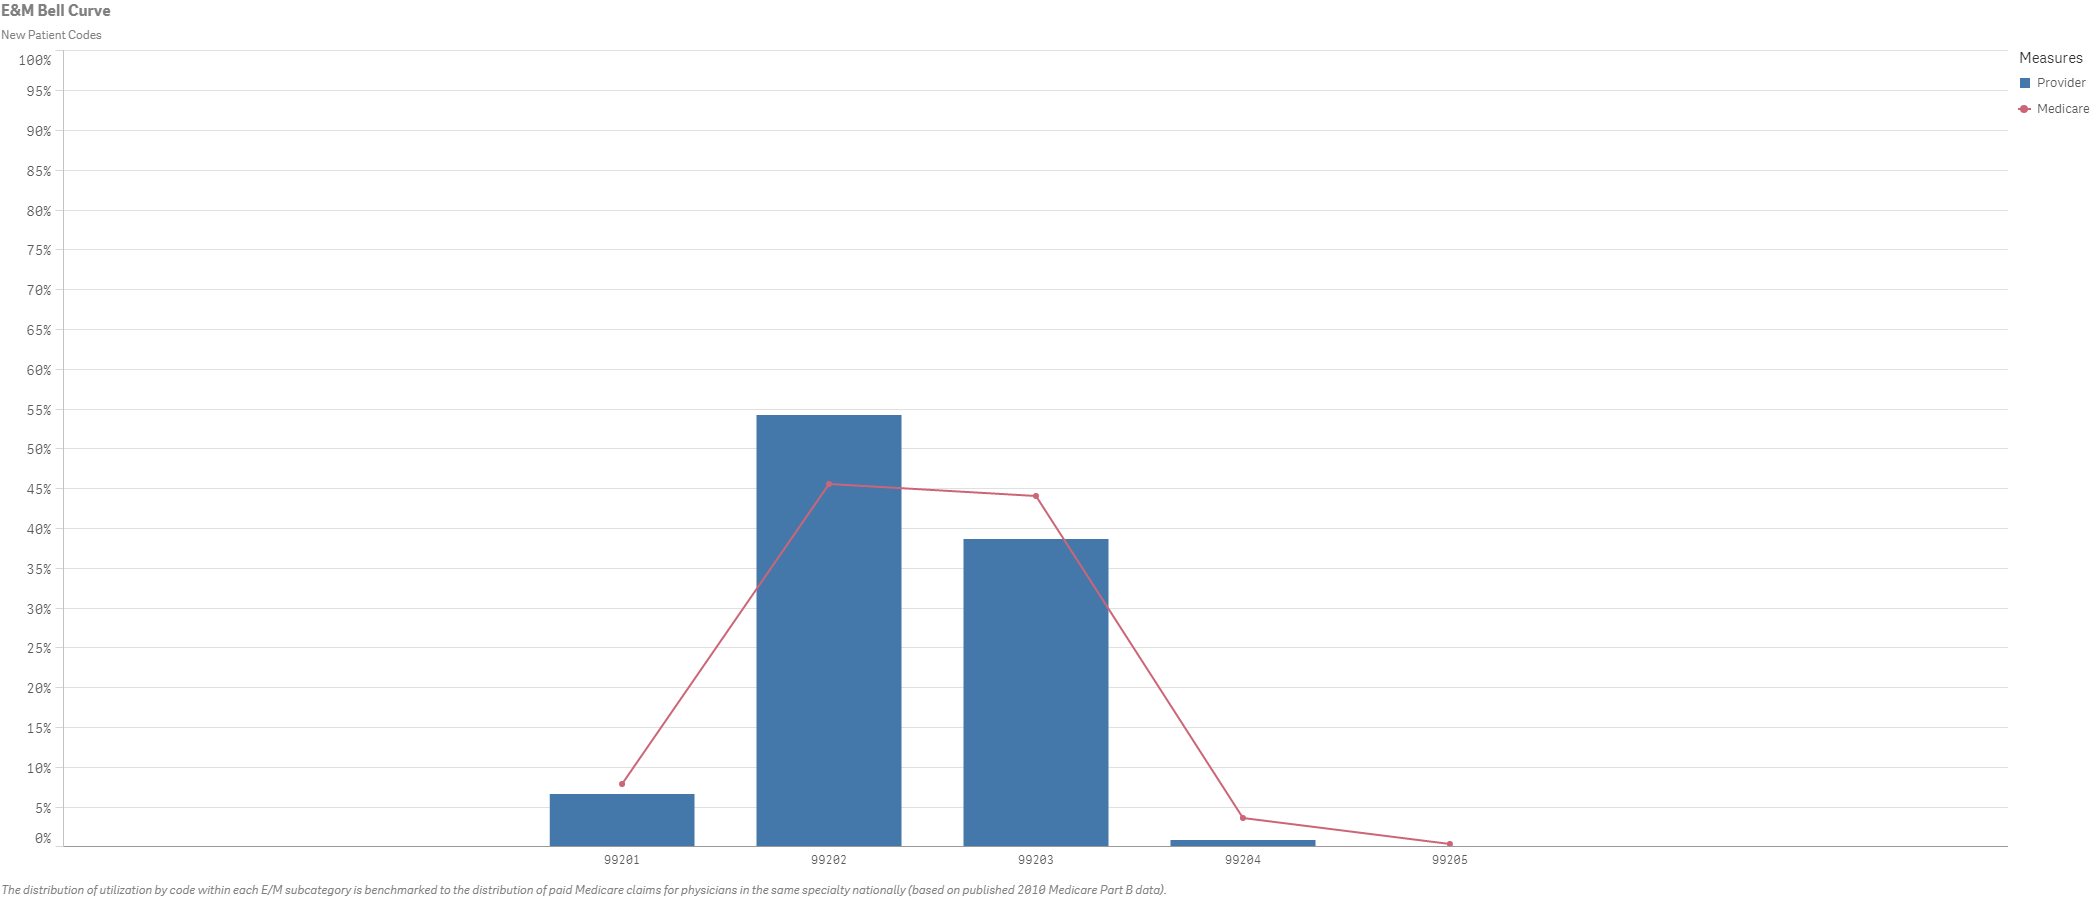
I need to create a combo chart that shows the volume of 5 specific CPT codes compared to the national average. There are only a few data points for the national average (see below). Any way I can manually input the data below to create the line to overlay with my bar chart?
New Pt Code | Medicare |
| 99201 | 7.10% |
| 99202 | 45.40% |
| 99203 | 43.90% |
| 99204 | 3.50% |
| 99205 | 0.20% |
Accepted Solutions
- Mark as New
- Bookmark
- Subscribe
- Mute
- Subscribe to RSS Feed
- Permalink
- Report Inappropriate Content
There are two approaches I can think of:
1) Load the Medicare values into a separate field, in the same table as the rest of the data, or a new table linked on PTCode.
2) Code the values in an expression like this:
pick(Match([PT Code],'99200','99201','99202','99203','99204','99205')
,'.07710','.4540','.4390','.0350','.0020')
Example attached (QV & QS) showing both solutions.
-Rob
- Mark as New
- Bookmark
- Subscribe
- Mute
- Subscribe to RSS Feed
- Permalink
- Report Inappropriate Content
if you whant show only this codes use expression below:
exemple
sum({<[New Pt Code]={">=99201","<=99205"}>} you field)
- Mark as New
- Bookmark
- Subscribe
- Mute
- Subscribe to RSS Feed
- Permalink
- Report Inappropriate Content
There are two approaches I can think of:
1) Load the Medicare values into a separate field, in the same table as the rest of the data, or a new table linked on PTCode.
2) Code the values in an expression like this:
pick(Match([PT Code],'99200','99201','99202','99203','99204','99205')
,'.07710','.4540','.4390','.0350','.0020')
Example attached (QV & QS) showing both solutions.
-Rob
- Mark as New
- Bookmark
- Subscribe
- Mute
- Subscribe to RSS Feed
- Permalink
- Report Inappropriate Content
Rob - it worked beautifully!
Gratitude.