Unlock a world of possibilities! Login now and discover the exclusive benefits awaiting you.

- Qlik Community
- :
- Forums
- :
- Analytics & AI
- :
- Products & Topics
- :
- Visualization and Usability
- :
- Re: Cumulative growth line
- Subscribe to RSS Feed
- Mark Topic as New
- Mark Topic as Read
- Float this Topic for Current User
- Bookmark
- Subscribe
- Mute
- Printer Friendly Page

 Qlik_Bio06
- Mark as New
- Bookmark
- Subscribe
- Mute
- Subscribe to RSS Feed
- Permalink
- Report Inappropriate Content
Cumulative growth line

Hi,
How to create a cumulative growth line that increases by 2.2 million per month?
Where can I enter the increase of 2.2 million?
Can someone help me or give me a tip?
Grretings
Ebi

 Dalton_Ruer
- Mark as New
- Bookmark
- Subscribe
- Mute
- Subscribe to RSS Feed
- Permalink
- Report Inappropriate Content
You can use an expression like RowNo()*2.2 million as the line in the Combo Chart
If you want the 2.2 million to be dynamic just create a variable and use dollar sign expansion in the formula to get the value of the variable: =RowNo() * $(vVariable)
You can use the Variable Input object from the Qlik Dashboard Bundle to allow the end user to modify the variable.
 mato32188
- Mark as New
- Bookmark
- Subscribe
- Mute
- Subscribe to RSS Feed
- Permalink
- Report Inappropriate Content
Hi @Qlik_Bio06,
instead of using Bar chart - Add-Ons - Reference Lines go for Combo Chart with dims and measures only.
Dim: Month(Created on)
Measure: rangesum(above(sum(2200000),NoOfRows())) - gives you cummulative of 2.2 mil for every Month(created on)

BR
m
Qlik_Bio06
- Mark as New
- Bookmark
- Subscribe
- Mute
- Subscribe to RSS Feed
- Permalink
- Report Inappropriate Content
Many thanks for the help. The 2.2 million should remain fixed for the time being. That should be okay now, right?
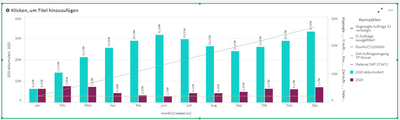
The chart shows the sales(CHF) for 2020 and then again the sales(CHF) accumulated.
How can I display the sales from the current year only?I don't currently have the data from 2021, but I wanted it to be an example for 2020
Is it correct?
SUM ({$ <Year = {'$ (= Year (Today ()) - 1)'}>} CHF) 2020
SUM ({$ <Year = {'$ (= Year (Today ()))'}>} CHF) 2021

Qlik_Bio06
- Mark as New
- Bookmark
- Subscribe
- Mute
- Subscribe to RSS Feed
- Permalink
- Report Inappropriate Content
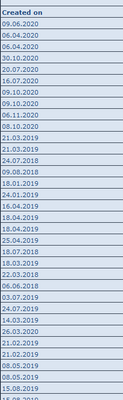
At the moment I'm also filtering some data using expression. What is the best solution here? Any suggestions?
Qlik_Bio06
- Mark as New
- Bookmark
- Subscribe
- Mute
- Subscribe to RSS Feed
- Permalink
- Report Inappropriate Content
Many thanks for the help. The 2.2 million should remain fixed for the time being. That should be okay now, right?
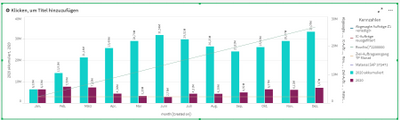
The chart shows the sales(CHF) for 2020 and then again the sales(CHF) accumulated.
How can I display the sales from the current year only?I don't currently have the data from 2021, but I wanted it to be an example for 2020
Is it correct?
SUM ({$ <Year = {'$ (= Year (Today ()) - 1)'}>} CHF) 2020
SUM ({$ <Year = {'$ (= Year (Today ()))'}>} CHF) 2021