Unlock a world of possibilities! Login now and discover the exclusive benefits awaiting you.

- Qlik Community
- :
- Forums
- :
- Analytics & AI
- :
- Products & Topics
- :
- Visualization and Usability
- :
- Re: Cumulative values trend line chart over time d...
- Subscribe to RSS Feed
- Mark Topic as New
- Mark Topic as Read
- Float this Topic for Current User
- Bookmark
- Subscribe
- Mute
- Printer Friendly Page

 zela9123
- Mark as New
- Bookmark
- Subscribe
- Mute
- Subscribe to RSS Feed
- Permalink
- Report Inappropriate Content
Cumulative values trend line chart over time duration
Hi All,
Please see below sample data set:
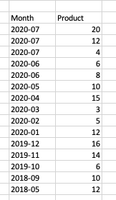
I would like to present trend line chart with cumulative values. What is more, the default view is set up for 2020. I am using below formula:
RangeSum(Above(Sum(Product), 0, RowNo()))
Generally it is working fine, but unfortunately it is showing cumulative values starting from 2020-01: 12, 2020-02: 17 etc. I want to show total cumulative values but with the YTD view (2020). So in 2020-01:70, 2020-02: 75 etc.
I look forward to hearing from you.
- « Previous Replies
-
- 1
- 2
- Next Replies »
zela9123
- Mark as New
- Bookmark
- Subscribe
- Mute
- Subscribe to RSS Feed
- Permalink
- Report Inappropriate Content
Hi,
In this scenario, Qlik is starting to count the cumulative values from 2020-01: which is 12, instead from 2018-05: which is 70.
Regards,
Zela

 Kushal_Chawda
- Mark as New
- Bookmark
- Subscribe
- Mute
- Subscribe to RSS Feed
- Permalink
- Report Inappropriate Content
So on line chart you want to see only YTD Months? and accumulation start from 2020-01? So for 2020-01=12, 2020-02 = 12+2020-02value?
zela9123
- Mark as New
- Bookmark
- Subscribe
- Mute
- Subscribe to RSS Feed
- Permalink
- Report Inappropriate Content
Hi,
The case is that I want to see YTD, but the accumulation should start from the very begging of the sample data, so in this case from 2018-05 (please check my screenshot uploaded on first post).
So I want to have values like:
2020-01 : 70 (accumulation from 2018, 2019 and 2020-01),
2020-02: 75,
2020-03: 78.. etc
Hope that it is clear now.
Thanks!
Regards,
Zela
Kushal_Chawda
- Mark as New
- Bookmark
- Subscribe
- Mute
- Subscribe to RSS Feed
- Permalink
- Report Inappropriate Content
You first need to convert Month to proper Date format like below.
Data:
Load *,
    date(date#(Month,'YYYYMM'),'YYYYMM') as MONTH;
LOAD * INLINE
[
Month,Product
201901,3
201902,9
201903,4
201904,10
201905,1
201906,2
201907,5
201908,9
201909,5
201910,2
201911,7
201912,9
202001,6
202002,4
202003,10
202004,8
202005,2
202006,2
202007,5
202008,10
202009,1
202010,8
202011,9
202012,9
](delimiter is ',');
Then you can use below expression
=sum({<MONTH={">=$(=date(yearstart(max(MONTH)),'YYYYMM'))"}>}aggr(RangeSum(Above(total Sum({<MONTH>}Product), 0, RowNo())),(MONTH,(NUMERIC,ASCENDING))))*avg(1)
Note: Use newly created Month field in dimension and expression

- « Previous Replies
-
- 1
- 2
- Next Replies »