Unlock a world of possibilities! Login now and discover the exclusive benefits awaiting you.
- Qlik Community
- :
- Forums
- :
- Analytics & AI
- :
- Products & Topics
- :
- Visualization and Usability
- :
- Date, Week, Month, Quarter and Year data filtratio...
- Subscribe to RSS Feed
- Mark Topic as New
- Mark Topic as Read
- Float this Topic for Current User
- Bookmark
- Subscribe
- Mute
- Printer Friendly Page
- Mark as New
- Bookmark
- Subscribe
- Mute
- Subscribe to RSS Feed
- Permalink
- Report Inappropriate Content
Date, Week, Month, Quarter and Year data filtration.
Hi Team,
Need assistance for a requirement which is like below:
I want Day, Week, Month, Quarter, Year selection option in my chart.
If anyone select as date then the date calendar should populate and the user should be able to select one or more dates in the calendar, accordingly data should filter out and shown to user.
similarly on month selection, 12 months should populate and User can be able to select the desired month to view the data. Similar for Week, Quarter and Year.
Basically this requirement need to see the reports in daily, weekly, monthly, quarterly and yearly basis.
Please let me know how it could be possible to achieve or suggest any alternate way if we can do. Also suggest if this can be done by using some extensions.
Any suggestions and helps would be highly appreciated.
Thanks and Regards,
Ipsita
- Mark as New
- Bookmark
- Subscribe
- Mute
- Subscribe to RSS Feed
- Permalink
- Report Inappropriate Content
Create inline table for dimensions values like daily, weekly, monthly, quarterly and yearly. And in chart you can use ge fieldselection and dimension values.
- Mark as New
- Bookmark
- Subscribe
- Mute
- Subscribe to RSS Feed
- Permalink
- Report Inappropriate Content
Maybe you need to create a MasterCalendar. Here you can find more information:
- Mark as New
- Bookmark
- Subscribe
- Mute
- Subscribe to RSS Feed
- Permalink
- Report Inappropriate Content
Assuming you have Day, Week, Month, Quarter, Year fields, and you are using this in bar chart, you could use alternate dimensions which will allow the user to interactively select the required dimension. The user can select the relevant filters from a filter pane or the smart search option.
- Mark as New
- Bookmark
- Subscribe
- Mute
- Subscribe to RSS Feed
- Permalink
- Report Inappropriate Content
You can link your date field with the below script
******************************************************************************************************************
Let vFromDate = '01/01/2017';
Let vToDate = '31/12/2019';
Temp_Calendar:
LOAD
date('$(vFromDate)' + IterNo()-1) as Date
AutoGenerate 1 While ('$(vFromDate)' + IterNo()-1) <= '$(vToDate)';
Calendar:
Load Date,
Floor(Date) as LinkDate,
Year(Date) as Year,
Month(Date) as Month,
Week(Date) as Week,
WeekDay(Date) as Day,
Ceil(Num(Month(Date))/3) as Quarter
Resident Temp_Calendar;
DROP Table Temp_Calendar;
******************************************************************************************************************
Note: Variables "vFromDate" and "vToDate" must be min and max dates from your data respectively.
- Mark as New
- Bookmark
- Subscribe
- Mute
- Subscribe to RSS Feed
- Permalink
- Report Inappropriate Content
Hi,
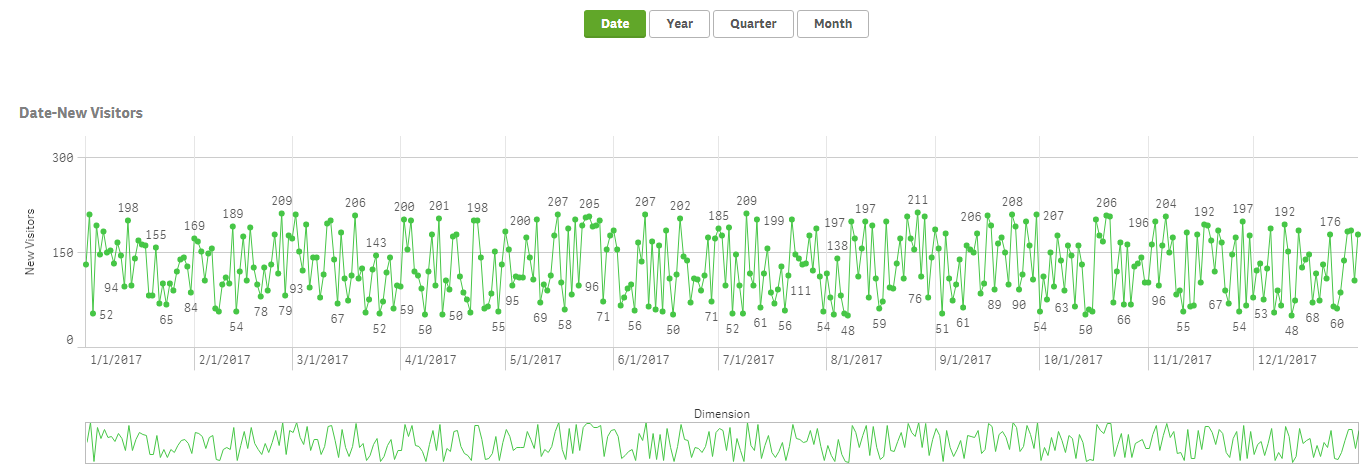
May be this. You can Try using QSVariable extension something like below. Please find the attached sample app.
http://branch.qlik.com/#!/project/56728f52d1e497241ae697f8
- Mark as New
- Bookmark
- Subscribe
- Mute
- Subscribe to RSS Feed
- Permalink
- Report Inappropriate Content
Thanks Kumar for the demo app.
Do I need to script anything more if I use the variable extension?
- Mark as New
- Bookmark
- Subscribe
- Mute
- Subscribe to RSS Feed
- Permalink
- Report Inappropriate Content
Hi,
No need any script changes.