Unlock a world of possibilities! Login now and discover the exclusive benefits awaiting you.
Announcements
Qlik and ServiceNow Partner to Bring Trusted Enterprise Context into AI-Powered Workflows. Learn More!
- Qlik Community
- :
- Forums
- :
- Analytics & AI
- :
- Products & Topics
- :
- Visualization and Usability
- :
- Re: Display multiple lines with same value
Options
- Subscribe to RSS Feed
- Mark Topic as New
- Mark Topic as Read
- Float this Topic for Current User
- Bookmark
- Subscribe
- Mute
- Printer Friendly Page
Turn on suggestions
Auto-suggest helps you quickly narrow down your search results by suggesting possible matches as you type.
Showing results for
Master
2016-10-18
08:30 AM
- Mark as New
- Bookmark
- Subscribe
- Mute
- Subscribe to RSS Feed
- Permalink
- Report Inappropriate Content
Display multiple lines with same value
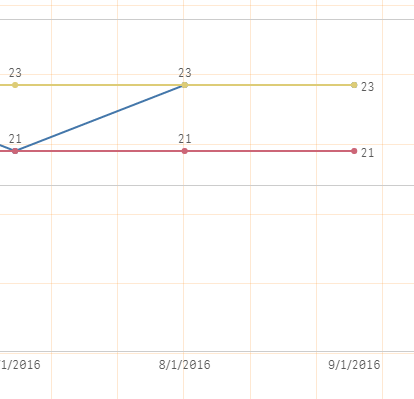
I have a line chart in QS.
Two of the lines end up having the same value in the current month. However, the chart only shows one of the lines (yellow) and not the blue line. So it is very confusing to the user as the blue line disappeared in this month.
If 2 lines have the same value is it possible to display both lines or do something to indicate that there are 2?
I attached an image of what is happening.
950 Views
1 Reply
Partner - Master III
2016-10-18
11:59 AM
- Mark as New
- Bookmark
- Subscribe
- Mute
- Subscribe to RSS Feed
- Permalink
- Report Inappropriate Content
However it is not possible.. It will overlap and one of the line will b invisible..
When the user will hover on that particular point,it will show value for both lines
888 Views