Unlock a world of possibilities! Login now and discover the exclusive benefits awaiting you.

- Qlik Community
- :
- Forums
- :
- Analytics & AI
- :
- Products & Topics
- :
- Visualization and Usability
- :
- Divide sales into value-groups
- Subscribe to RSS Feed
- Mark Topic as New
- Mark Topic as Read
- Float this Topic for Current User
- Bookmark
- Subscribe
- Mute
- Printer Friendly Page

 reinholdgraf
- Mark as New
- Bookmark
- Subscribe
- Mute
- Subscribe to RSS Feed
- Permalink
- Report Inappropriate Content
Divide sales into value-groups
Input are sales per sales-rep and date.
I want to divide them into certain value-groups according to their sale-volume (e.g. 1 - 10.000, 10.001 - 50.000, etc.) and then show group-sums (count and value).
E.G. in group 1 - 10.000 are 30 invoices with a total sales of 50.000.-
How can I do that ?
Reinhold
- Tags:
- split-up

- Mark as New
- Bookmark
- Subscribe
- Mute
- Subscribe to RSS Feed
- Permalink
- Report Inappropriate Content
Hello,
You could try something like:
if(aggr(Sum(Sales), id_sales_rep) >= 1 and aggr(Sum(Sales), id_sales_rep) < 1000, 'Group 1', 'Group 2')
You can extend the number of groups by creating new conditions.
I recommend you to create a master item in order to reuse the new dimension within your app.
I hope it helps,
Estela
reinholdgraf
- Mark as New
- Bookmark
- Subscribe
- Mute
- Subscribe to RSS Feed
- Permalink
- Report Inappropriate Content
I assume, this has to be done in the data-editor, when inputting the data into qs ?
- Mark as New
- Bookmark
- Subscribe
- Mute
- Subscribe to RSS Feed
- Permalink
- Report Inappropriate Content
You would say you have three options in this case:
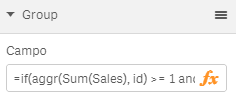
1. You can add a dimension to your chart and write your expression, as follows:
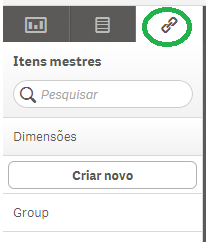
2. You can create a new dimension as a 'Master Item', so you do not have to copy and paste the expression every time you want to use the dimension (see Qlik Sense Desktop -- Using The Master Library - YouTube):
*Note that the master item is limited to your app
3. Or you can create a new column in the load script.
Estela

 DavidFoster1
- Mark as New
- Bookmark
- Subscribe
- Mute
- Subscribe to RSS Feed
- Permalink
- Report Inappropriate Content