Unlock a world of possibilities! Login now and discover the exclusive benefits awaiting you.
- Qlik Community
- :
- Forums
- :
- Analytics & AI
- :
- Products & Topics
- :
- Visualization and Usability
- :
- Excluding a filter from a particular chart
- Subscribe to RSS Feed
- Mark Topic as New
- Mark Topic as Read
- Float this Topic for Current User
- Bookmark
- Subscribe
- Mute
- Printer Friendly Page
- Mark as New
- Bookmark
- Subscribe
- Mute
- Subscribe to RSS Feed
- Permalink
- Report Inappropriate Content
Excluding a filter from a particular chart
Hi,
I am creating a sheet where I have two charts, I want to apply all filters on one chart but all except one on the other. could you please help me with the best way to do it? I tried using set analysis, something like -
=Sum({<[Reporting Customer]=>}[Gross Sales]) This works well for such cases, but does not work for chart where I do not have an aggregation such as in a histogram, or in cases where I use a calculated field such as % contribution where I basically do sum(sales for a particular customer)/sum (Net sales).
Is there a better way than using set analysis, I tried alternate state, but that wont allow me to apply all except one, I am only able to assign one state to one chart.
Any suggestions are much appreciated!
- « Previous Replies
-
- 1
- 2
- Next Replies »
- Mark as New
- Bookmark
- Subscribe
- Mute
- Subscribe to RSS Feed
- Permalink
- Report Inappropriate Content
hic - Is it possible to ignore selections in a histogram chart within Qlik Sense?
- Mark as New
- Bookmark
- Subscribe
- Mute
- Subscribe to RSS Feed
- Permalink
- Report Inappropriate Content
Currently, no.
You could create a histogram manually, using
Dimension = Class([Net Sales], 10)
Measure = Count([Net Sales])
Then you can use any set expression in your measure.
- Mark as New
- Bookmark
- Subscribe
- Mute
- Subscribe to RSS Feed
- Permalink
- Report Inappropriate Content
Thanks very much, this is exactly what I was trying to do. One of the issue is that the bin width changes automatically with application of filters but in this case that wont happen.
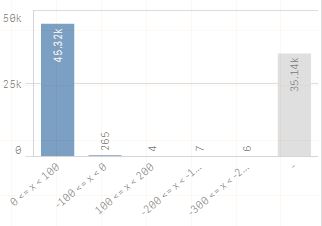
Also, when I create this bar chart, could you help me understand what the grey bar here interpret?
- Mark as New
- Bookmark
- Subscribe
- Mute
- Subscribe to RSS Feed
- Permalink
- Report Inappropriate Content
The grey bar is most likely non-numeric values of the field. Blanks, perhaps.
- Mark as New
- Bookmark
- Subscribe
- Mute
- Subscribe to RSS Feed
- Permalink
- Report Inappropriate Content
Ah, okay... Thanks a lot for your help! 
- « Previous Replies
-
- 1
- 2
- Next Replies »