Unlock a world of possibilities! Login now and discover the exclusive benefits awaiting you.

- Qlik Community
- :
- Forums
- :
- Analytics & AI
- :
- Products & Topics
- :
- Visualization and Usability
- :
- Fix Dimension basing on user values or certain spe...
- Subscribe to RSS Feed
- Mark Topic as New
- Mark Topic as Read
- Float this Topic for Current User
- Bookmark
- Subscribe
- Mute
- Printer Friendly Page

 michael_anywar
- Mark as New
- Bookmark
- Subscribe
- Mute
- Subscribe to RSS Feed
- Permalink
- Report Inappropriate Content
Fix Dimension basing on user values or certain specific values
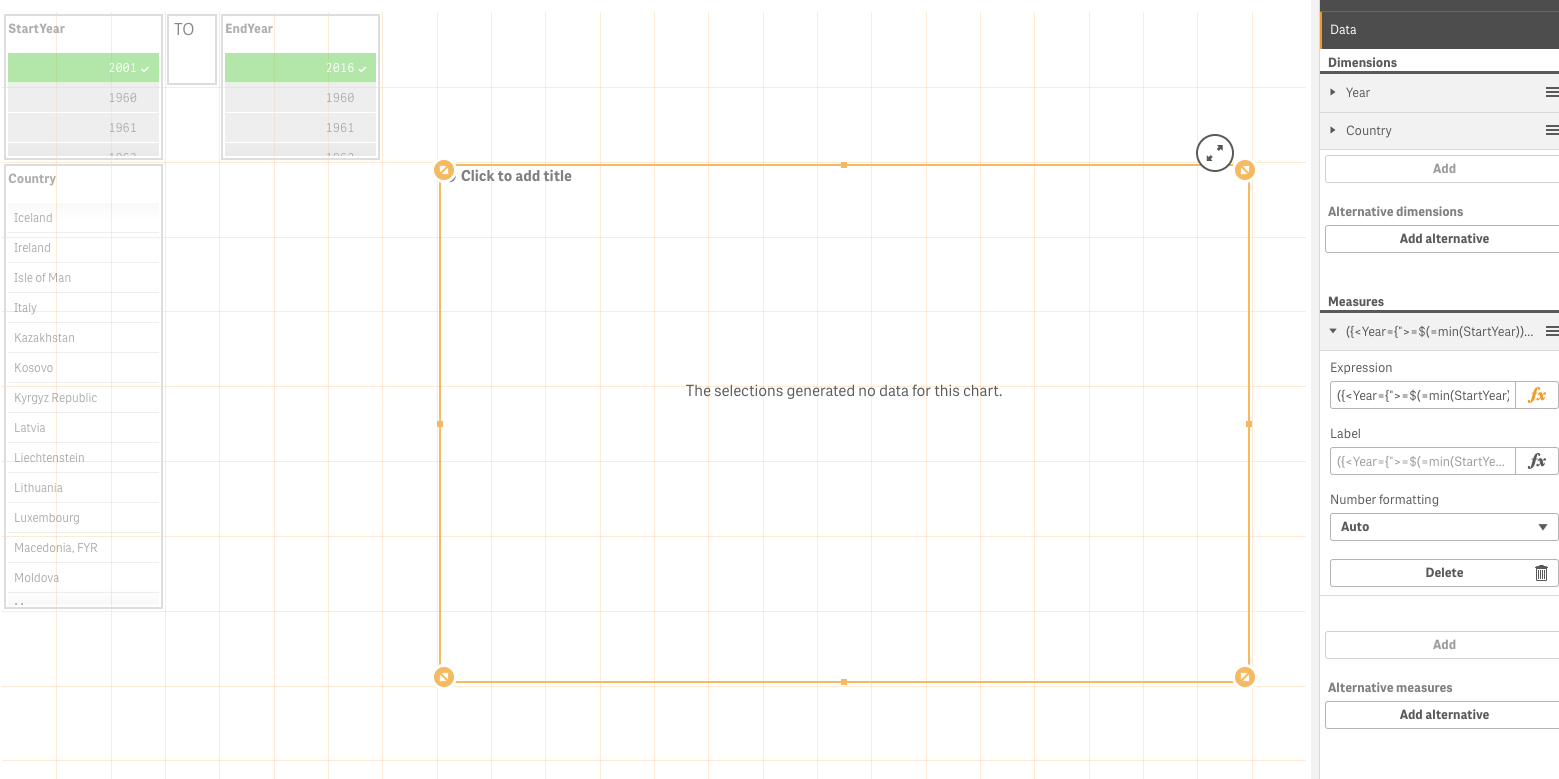
I would like to fix the dimensions of the graph by years on the x-axis either basing on user selection or if I can define my own values, that would also be great. AT the moment I used this:
({<Year={">=$(=min(StartYear))<=$(=max(EndYear))"}>}[GDP per capita (current US$)]) But it is not working.
If I can fix in the expression without using the StartYear and EndYear, that would be great.
Any help..?
This would help compare either 2 years on just one specific. Will highly appreciate any help
- Tags:
- fixed dimension
Accepted Solutions

 sunny_talwar
- Mark as New
- Bookmark
- Subscribe
- Mute
- Subscribe to RSS Feed
- Permalink
- Report Inappropriate Content
Did you forget to add a sum or avg or something similar function?
Sum({<Year = {">=$(=min(StartYear))<=$(=max(EndYear))"}>} [GDP per capita (current US$)])
sunny_talwar
- Mark as New
- Bookmark
- Subscribe
- Mute
- Subscribe to RSS Feed
- Permalink
- Report Inappropriate Content
Did you forget to add a sum or avg or something similar function?
Sum({<Year = {">=$(=min(StartYear))<=$(=max(EndYear))"}>} [GDP per capita (current US$)])
michael_anywar
- Mark as New
- Bookmark
- Subscribe
- Mute
- Subscribe to RSS Feed
- Permalink
- Report Inappropriate Content
Actually are right I thought the functions did't have any issues but the do affect. Thanks Sunny.
