Unlock a world of possibilities! Login now and discover the exclusive benefits awaiting you.

- Qlik Community
- :
- Forums
- :
- Analytics & AI
- :
- Products & Topics
- :
- Visualization and Usability
- :
- Format single data points on chart
Options
- Subscribe to RSS Feed
- Mark Topic as New
- Mark Topic as Read
- Float this Topic for Current User
- Bookmark
- Subscribe
- Mute
- Printer Friendly Page
Turn on suggestions
Auto-suggest helps you quickly narrow down your search results by suggesting possible matches as you type.
Showing results for

 resajdak
Contributor II
2019-01-18
06:44 AM
- Mark as New
- Bookmark
- Subscribe
- Mute
- Subscribe to RSS Feed
- Permalink
- Report Inappropriate Content
Format single data points on chart
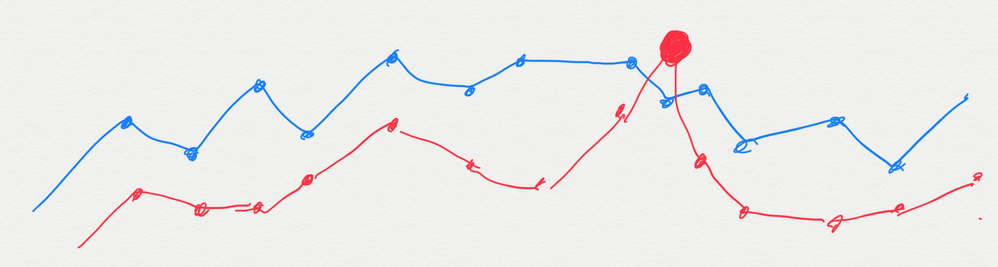
Is there a way to format or change the appearance of a data point on a chart when a condition is met in qlik sense? For example, in the attached graphic, I'd like to increase the point size whenever a red data point is greater than the blue point.
- Tags:
- chart
1,515 Views
2 Replies

 agni_gold
Specialist III
2019-01-18
06:51 AM
- Mark as New
- Bookmark
- Subscribe
- Mute
- Subscribe to RSS Feed
- Permalink
- Report Inappropriate Content
I don't think, we can customize pointer size, experts, please advise.
1,505 Views
resajdak
Contributor II
2019-01-18
08:19 AM
Author
- Mark as New
- Bookmark
- Subscribe
- Mute
- Subscribe to RSS Feed
- Permalink
- Report Inappropriate Content
If point size can't be changed, can I change point color or shape. Basically, I'm just trying to visually highlight when the red line is greater then the blue
1,491 Views
