Unlock a world of possibilities! Login now and discover the exclusive benefits awaiting you.

- Qlik Community
- :
- Forums
- :
- Analytics & AI
- :
- Products & Topics
- :
- Visualization and Usability
- :
- Function with SUM and IF or another... ?
- Subscribe to RSS Feed
- Mark Topic as New
- Mark Topic as Read
- Float this Topic for Current User
- Bookmark
- Subscribe
- Mute
- Printer Friendly Page

 Peet
Peet
- Mark as New
- Bookmark
- Subscribe
- Mute
- Subscribe to RSS Feed
- Permalink
- Report Inappropriate Content
Function with SUM and IF or another... ?
Hello community,
Iam a new user of Qlik, and little bit lost. Iam trying to do a SUM of one field based on unique items of another field.
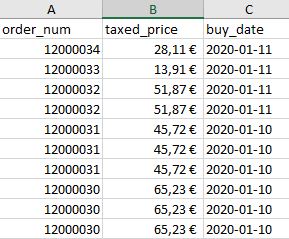
Column Order_Num contains numbers of order, but multiple times, based on how many items was sold in each order. How can I sum the Taxed_price only for unique Order_Num - I want to use it like mesure in chart that will show amount of order sales per month for exemple.
Thank You.
Accepted Solutions
Peet
- Mark as New
- Bookmark
- Subscribe
- Mute
- Subscribe to RSS Feed
- Permalink
- Report Inappropriate Content
Oh, its too much for beginer like me, but Thank you anyway. With this function it works correctly for my tables/charts.
sum(aggr(max(taxed_price),order_num))

 Kushal_Chawda
- Mark as New
- Bookmark
- Subscribe
- Mute
- Subscribe to RSS Feed
- Permalink
- Report Inappropriate Content
If I understood correctly, you would need to do something like below
Sum({<Order_Num = {"=Count(Order_Num)=1"}>}Taxed_price)
If it doesn't work, please provide sample data with expected output
Peet
- Mark as New
- Bookmark
- Subscribe
- Mute
- Subscribe to RSS Feed
- Permalink
- Report Inappropriate Content
Hello Kush,
thx for answer, but it doesnt work.
What I need, is to SUM unique prices for each unique order to put them into chart per date. So the expected output is chart with Januray - orders for 1543,26... then february and so on...
in the excel I have to make a pivot table first to have unique min or max amounts (cause they are same per order) of orders, then put in a new table with date fields and then make a chart with theese data. Think in qlik it should be much easier, just find the right way 🙂
Kushal_Chawda
- Mark as New
- Bookmark
- Subscribe
- Mute
- Subscribe to RSS Feed
- Permalink
- Report Inappropriate Content
If you want the chart by Month then you need to create the Month Field in your Data. I would suggest to create Master calendar and link it with buy_date, but for example I have created Month field in your data
Data:
LOAD order_num,
taxed_price,
date(date#(buy_date,'YYYY-MM-DD')) as buy_date,
month(date#(buy_date,'YYYY-MM-DD')) as Month
FROM
[C:\\exemple.xlsx]
(ooxml, embedded labels, table is Hárok1);
Now you can create chart with Dimension Month & Below expression. If you want to create chart by Date then replace Month in below expression with buy_date

= sum(aggr(max(taxed_price),order_num,Month))- Mark as New
- Bookmark
- Subscribe
- Mute
- Subscribe to RSS Feed
- Permalink
- Report Inappropriate Content
Oh, its too much for beginer like me, but Thank you anyway. With this function it works correctly for my tables/charts.
sum(aggr(max(taxed_price),order_num))
Kushal_Chawda
- Mark as New
- Bookmark
- Subscribe
- Mute
- Subscribe to RSS Feed
- Permalink
- Report Inappropriate Content
Please mark the answer as a correct to close this thread
Kushal_Chawda
- Mark as New
- Bookmark
- Subscribe
- Mute
- Subscribe to RSS Feed
- Permalink
- Report Inappropriate Content
Looks like my solution does not work for you. Anyway glad that you got answer
