Unlock a world of possibilities! Login now and discover the exclusive benefits awaiting you.

- Qlik Community
- :
- Forums
- :
- Analytics & AI
- :
- Products & Topics
- :
- Visualization and Usability
- :
- GetFieldSelections and Dynamic Title and rangesum(...
- Subscribe to RSS Feed
- Mark Topic as New
- Mark Topic as Read
- Float this Topic for Current User
- Bookmark
- Subscribe
- Mute
- Printer Friendly Page

- Mark as New
- Bookmark
- Subscribe
- Mute
- Subscribe to RSS Feed
- Permalink
- Report Inappropriate Content
GetFieldSelections and Dynamic Title and rangesum()
Hello Everybody,
I'm a student, and i'm a newbie. i discovered qliksense desktop yesterday.
i dont find in forum my answer. so i will try to post here and i hope to have answer 
My input file is Excel. In this file i have worksheet "calendrier" wich contains :
date(dd-mm-yyyy) / year / month .
In Load script i did :
LOAD
    idTemps,
    date,
    jour,
    mois,
    annee,
    li_mois,
    (annee&'-'&if(len(trim([date]))>0, 'S'&num(ceil(month([date])/6)))) as annee_semestre,

    (annee&'-'&li_mois) as annee_mois,

    (annee&'-'&if(len([date])>0, 'T' & ceil(month([date])/3))) as annee_trimestre


FROM [lib://ProtoX/Dimensions.xlsx]
(ooxml, embedded labels, table is Dim_Temps)
WHERE annee = Year(Today())-1 or annee = year(Today())
;
I have 3 problems :
1st exigence of my client is : would like to create 1 dimension called "Periode" and values on this dimension :
2015-01

2015-02

2015-03
2015-04
2015-05
2015-06
2014-01
2014-02
2014-03
2014-04
2015-Q1
2015-Q2
2015-S1
2015-S2
2014-S1
2014-S2
This dimension its for use in "filter"
In your point of view its possible to create this specific value ? i tried but it was not a success
2nd : I try to have dynamic title
For exemple if my client filtered on ' 2014-04,2014-03' i would like to have ' analyse on year : 2014 and on month : April and March
'Analyse : ' & Subfield(GetFieldSelections(annee_mois),'-',1) & ' ' & subfield(concat(GetFieldSelections(annee_mois),','),'-',2)
it's ok for year but not for month and i dont understand why ?
2nd :Crosstab
In my crosstab my client wants to see specific order, so i used :
WildMatch(li_Magasin,'Lyon','*')
Now i would like to insert a row "TOTAL" above my first row. its cumulative sum by "li_magasin"*
i saw on forum this fonction
rangesum()
I hope you can help me, thank you for your time.
PS : sorry for my English 
- « Previous Replies
-
- 1
- 2
- Next Replies »
Accepted Solutions

 brunobertels
- Mark as New
- Bookmark
- Subscribe
- Mute
- Subscribe to RSS Feed
- Permalink
- Report Inappropriate Content
Hi
At last for your 3rd point
In a Table chart like below to get a total row
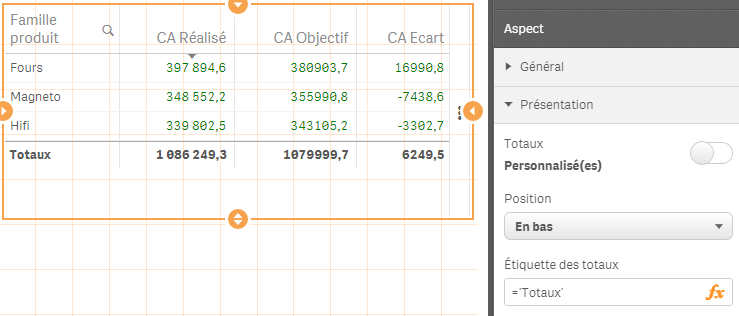
in the "Aspect" Panel / présentation you have the option to show or hide the total row
Total row can be sum avg max Min or expression
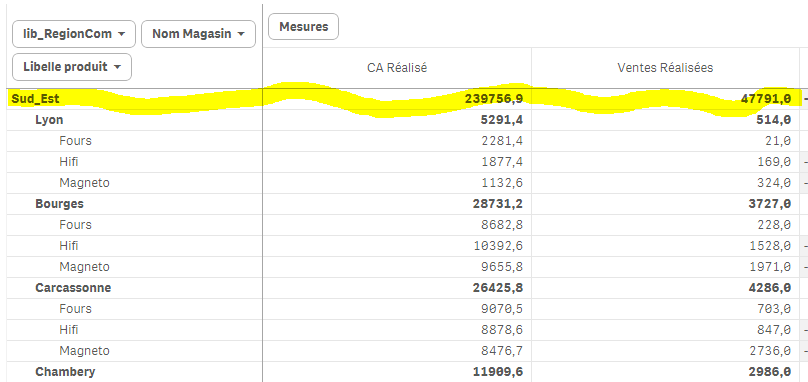
If you want a total Row now in a TCD (crosstabe) look below
i've just add the dimension lib_Regioncom so it's gaving me the total for this region
regards

 Gysbert_Wassena
- Mark as New
- Bookmark
- Subscribe
- Mute
- Subscribe to RSS Feed
- Permalink
- Report Inappropriate Content
1. Create a new table in the script with a new field that you'll use as Dimension
Periods:
LOAD * INLINE [
Period, Month
2015-01, 2015-01
2015-02, 2015-02
...etc
2015-Q1, 2015-01
2015-Q1, 2015-02
2015-Q1, 2015-03
2015-Q2, 2015-04
...etc
2015-S1, 2015-01
2015-S1, 2015-02
...etc, you should get the idea by now
];
You can use the Period field to make selections in and the appropriate Month values will be used in calculations.
2. Have you tried something like ='Analyse: ' & Only(Year) & ' ' & concat(distinct Month, ' - ' )
3. Set the Show Totals option of that dimension to On.
talk is cheap, supply exceeds demand
- Mark as New
- Bookmark
- Subscribe
- Mute
- Subscribe to RSS Feed
- Permalink
- Report Inappropriate Content
Hello,
Thank you for your answer.
For the first point :
I created dimension, but when i use it as filter : my tab is empty. And i dont understand why.
LOAD * INLINE [
Period, annee_mois
2015-01,2015-01
2015-T1,2015-01
2015-T1,2015-02
2015-T1,2015-03
2015-S1,2015-06
2015-S2,2015-07
[...]
];
2nd point :
Not tested yet, because first point its not ok.
3nd point :
Actually i have in my crosstab
each CA by store
I would like something like that : Create a fake store called 'Total'
and in this 'fake' store have global(ca).
In sql : Select sum(ca), 'total' as store from mytable.

 marcus_sommer
- Mark as New
- Bookmark
- Subscribe
- Mute
- Subscribe to RSS Feed
- Permalink
- Report Inappropriate Content
1.) I think it could be useful to associate your data with a master-calendar: How to use - Master-Calendar and Date-Values
2.) getcurrentselections() could be an alternatively to concat
3.) Of course it's possible to create dummy-rows for dimensions (most often added per concatenate load from a small inline-table) but then you need to adjust your expressions for each kind of dimension-values - the normal one, the dummy and maybe a third for the totals. This should be only used if it's really needed - in most cases is the suggestion from Gysbert (enable totals respectively partial sums) the best suitable.
- Marcus
brunobertels
- Mark as New
- Bookmark
- Subscribe
- Mute
- Subscribe to RSS Feed
- Permalink
- Report Inappropriate Content
Hi
First for period see attached qvf file : I use variable and qsvariable extension available on qlik branch
So you can have a dynamic period dimension :
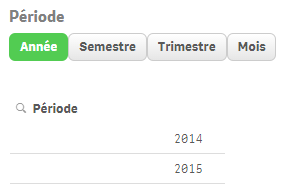
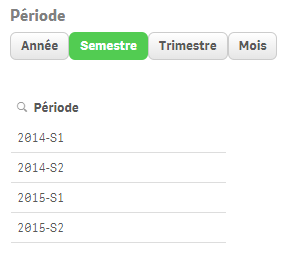
hope it helps
Bruno
- Mark as New
- Bookmark
- Subscribe
- Mute
- Subscribe to RSS Feed
- Permalink
- Report Inappropriate Content
Hi,
Thanks both for your answers.
brunobertels wow i would like this. But when i try your QVF i have this error
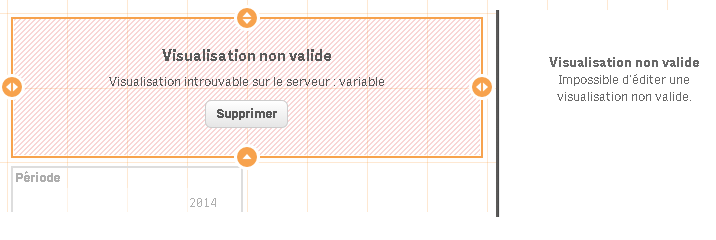
i can try to translate it in English : Visualization is invalid. Visualization not found on server (which server ?) : variable.
And on the right section : Visualization is invalid, Impossible to edit an invalid visualization.
Thank you
brunobertels
- Mark as New
- Bookmark
- Subscribe
- Mute
- Subscribe to RSS Feed
- Permalink
- Report Inappropriate Content
hi
First go here to dowload the extension named Qsvariable
https://github.com/erikwett/qsVariable
you will found lots of available extension here :
http://branch.qlik.com/projects/forumdisplay.php?6-Projects&sort=dateline&order=desc
fallow instruction to install it depending of your qlik version ( desktop or server)
then reload the app and it will be OK
you will see this on the left in graph panel :
bruno
- Mark as New
- Bookmark
- Subscribe
- Mute
- Subscribe to RSS Feed
- Permalink
- Report Inappropriate Content
Hi,
Thank you, now its ok, i downloaded this extension and now my dashboard looks pretty ^^.
Thank you again
- Mark as New
- Bookmark
- Subscribe
- Mute
- Subscribe to RSS Feed
- Permalink
- Report Inappropriate Content
Hi
Thank you for your answer. Now First and second point are ok. Solution of Gysbert is ok, its me who do a mistake.
Now i'm looking for my third point.
I understand your point Marcus,I would like to use it anyway
I want in my dashboard a sum by each store and global sum. If you can explain me how, it will be a pleasure.
Regards.
marcus_sommer
- Mark as New
- Bookmark
- Subscribe
- Mute
- Subscribe to RSS Feed
- Permalink
- Report Inappropriate Content
Table-charts have an inbuilt option to show totals for a dimension - in qlikview it's very easy but I don't know where these options are placed in Sense.
- Marcus
- « Previous Replies
-
- 1
- 2
- Next Replies »