Unlock a world of possibilities! Login now and discover the exclusive benefits awaiting you.

- Qlik Community
- :
- Forums
- :
- Analytics & AI
- :
- Products & Topics
- :
- Visualization and Usability
- :
- Getting dimension's value in the bar chart even if...
- Subscribe to RSS Feed
- Mark Topic as New
- Mark Topic as Read
- Float this Topic for Current User
- Bookmark
- Subscribe
- Mute
- Printer Friendly Page

 yatra_qlik
- Mark as New
- Bookmark
- Subscribe
- Mute
- Subscribe to RSS Feed
- Permalink
- Report Inappropriate Content
Getting dimension's value in the bar chart even if Corresponding measure is null.
Hi,
I have a timestamp dimension common for 4 tables.
Now if I plot this dimension against a measure on a Bar/Line chart if for some minute of the hour the value does not exist, it eliminates from the chart.
For example, if I am looking for different colors Shirts sold per minute of the day. My data for an hour say between 16:00 to 17:00 will look like this:
16:01 - 4
16:02 - 5
16:03 - 2 and so on for every minute till 17:00.
Now take a case of RED shirts
16:01 - 1
16:02 - 0
16:03 - 1
and so on.
When I select RED from the color filter on the sheet the dimension on the graph does not show 16:02.
In a nutshell, on any selection, if in a minute, I have 0 sales for any combination of selections, my chart of Sales per minute should reflect a zero for that minute so that I know intuitively in which minute my sales was ZERO.
Also, this leads to calculating false average lines on the graph. Like in the case of Red Shirts the average for 3 minutes should be 2/3 but if 16:02 is not displayed it calculates 1/1.
Any help on this would be much appreciated.

 vinieme12
- Mark as New
- Bookmark
- Subscribe
- Mute
- Subscribe to RSS Feed
- Permalink
- Report Inappropriate Content
uncheck supress zero values on Presentation tab, also post some sample data app with desired o/p
If a post helps to resolve your issue, please accept it as a Solution.
vinieme12
- Mark as New
- Bookmark
- Subscribe
- Mute
- Subscribe to RSS Feed
- Permalink
- Report Inappropriate Content
https://www.resultdata.com/force-qlikview-to-show-zero-values-on-a-chart/
If a post helps to resolve your issue, please accept it as a Solution.
yatra_qlik
- Mark as New
- Bookmark
- Subscribe
- Mute
- Subscribe to RSS Feed
- Permalink
- Report Inappropriate Content
Hi vinieme12
Please look 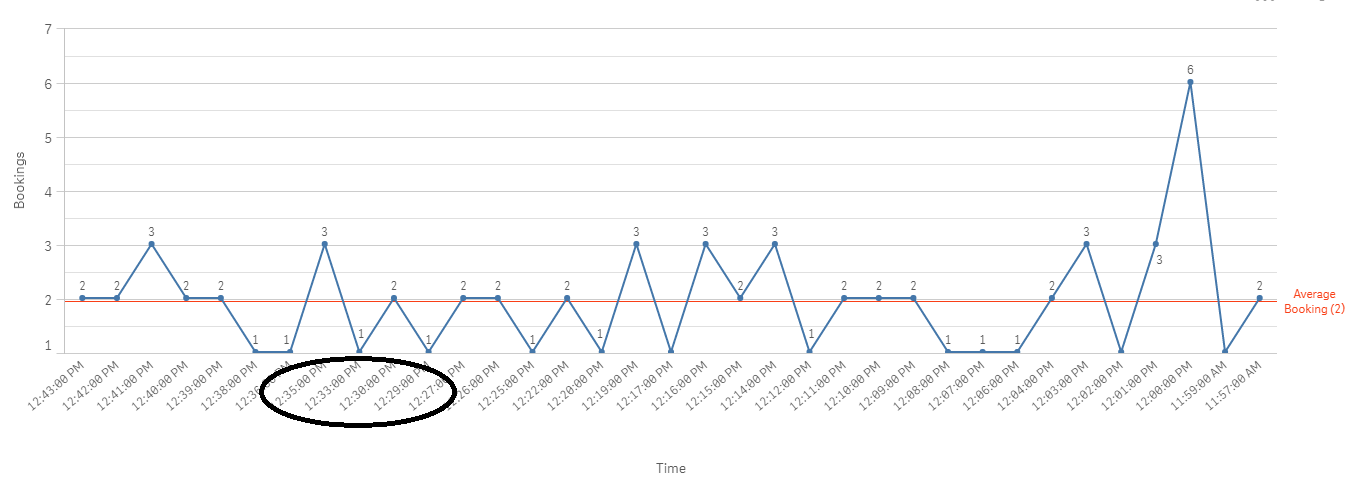
I want 12:28 PM, 12:31 PM and 12:32 PM and 12:44PM on the x-axis (Dimension) with measure value as null
I have tried the above 2. Also in the measure, I have tried if condition as If (count(xyz) >0 ,count(xyz),0) it is also not working.
NOTE: "Time" Dimension is the joining key across 4 tables.
Above Snapshot is for a filter (Like RED Shirts) as mentioned in the original Question.
vinieme12
- Mark as New
- Bookmark
- Subscribe
- Mute
- Subscribe to RSS Feed
- Permalink
- Report Inappropriate Content
have you tried this?
Do the following:
- In sheet view, click @Edit in the toolbar.
- Click the line chart that you want to edit.
- In the properties panel, click the Appearance tab.
- In the X-axis section, check Use continuous scale.The chart is compressed and the data points and labels are readjusted.
https://help.qlik.com/en-US/sense/3.0/Subsystems/Hub/Content/Visualizations/time-aware-charts.htm
If a post helps to resolve your issue, please accept it as a Solution.
