Unlock a world of possibilities! Login now and discover the exclusive benefits awaiting you.

- Qlik Community
- :
- Forums
- :
- Analytics & AI
- :
- Products & Topics
- :
- Visualization and Usability
- :
- GridChart doubt
Options
- Subscribe to RSS Feed
- Mark Topic as New
- Mark Topic as Read
- Float this Topic for Current User
- Bookmark
- Subscribe
- Mute
- Printer Friendly Page
Turn on suggestions
Auto-suggest helps you quickly narrow down your search results by suggesting possible matches as you type.
Showing results for

 rafakmargos
Contributor III
2022-06-29
04:31 PM
- Mark as New
- Bookmark
- Subscribe
- Mute
- Subscribe to RSS Feed
- Permalink
- Report Inappropriate Content
GridChart doubt
Hello,
I need to create a chart in QlikSense that I can change the size of bubble according to an expression, as below (This chart below is from QlikView:
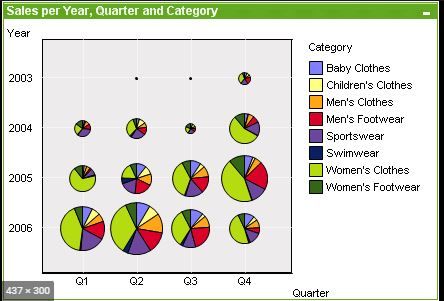
I noticed that I'm not able to do this in the pie chart or even in the Grid Chart in QlikSense.
Does anyone have an idea how can I do it?
553 Views
0 Replies
