Unlock a world of possibilities! Login now and discover the exclusive benefits awaiting you.

- Qlik Community
- :
- Forums
- :
- Analytics & AI
- :
- Products & Topics
- :
- Visualization and Usability
- :
- Help Required on Qlik Sense Bar Chart
- Subscribe to RSS Feed
- Mark Topic as New
- Mark Topic as Read
- Float this Topic for Current User
- Bookmark
- Subscribe
- Mute
- Printer Friendly Page

 piyush_s11
- Mark as New
- Bookmark
- Subscribe
- Mute
- Subscribe to RSS Feed
- Permalink
- Report Inappropriate Content
Help Required on Qlik Sense Bar Chart
Hi,
I have fields Year, Month, Product, Product Category, Cost.
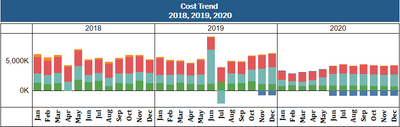
I wanted to draw a bar chart as shown image as shown below
Thanks in Advance
- Tags:
- qlik sense app
Accepted Solutions

 MayilVahanan
- Mark as New
- Bookmark
- Subscribe
- Mute
- Subscribe to RSS Feed
- Permalink
- Report Inappropriate Content
Hi @piyush_s11
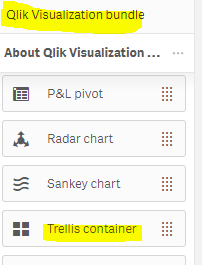
Try with Trellis container (Year as Dimension and add Master visualization which create with "Month & product as dimension & Cost as Measure), then add that Master visualization in Trellis container. Hope it helps
Please close the thread by marking correct answer & give likes if you like the post.
MayilVahanan
- Mark as New
- Bookmark
- Subscribe
- Mute
- Subscribe to RSS Feed
- Permalink
- Report Inappropriate Content
Hi @piyush_s11
Try with Trellis container (Year as Dimension and add Master visualization which create with "Month & product as dimension & Cost as Measure), then add that Master visualization in Trellis container. Hope it helps
Please close the thread by marking correct answer & give likes if you like the post.
