Unlock a world of possibilities! Login now and discover the exclusive benefits awaiting you.
- Qlik Community
- :
- Forums
- :
- Analytics & AI
- :
- Products & Topics
- :
- Visualization and Usability
- :
- Hide last data point in a combo chart
- Subscribe to RSS Feed
- Mark Topic as New
- Mark Topic as Read
- Float this Topic for Current User
- Bookmark
- Subscribe
- Mute
- Printer Friendly Page
- Mark as New
- Bookmark
- Subscribe
- Mute
- Subscribe to RSS Feed
- Permalink
- Report Inappropriate Content
Hide last data point in a combo chart
I am working on a simple visualization in which, commonly, the more recent week of data is incorrect.
Dimension: =week
Value: =sum(sales)

How can i do so that the plot does not show the latest week?
Accepted Solutions
- Mark as New
- Bookmark
- Subscribe
- Mute
- Subscribe to RSS Feed
- Permalink
- Report Inappropriate Content
You can use set analysis for your measure:
For example I have the following data:
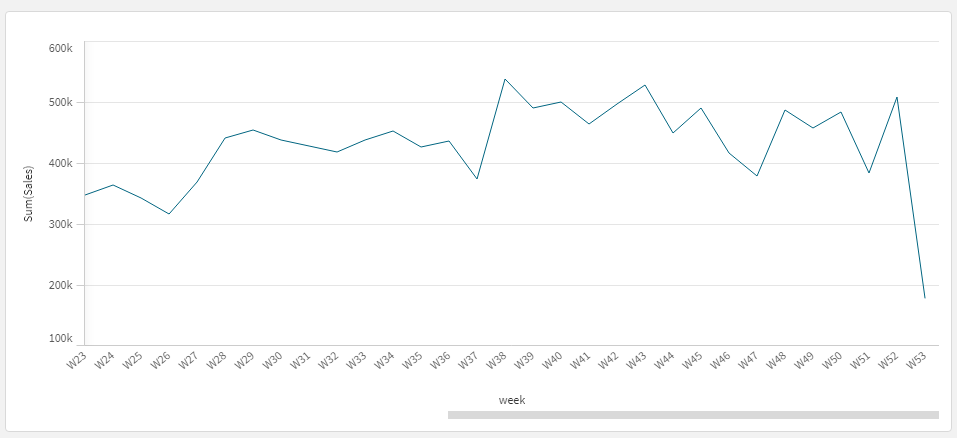
As you can see we don't want the week 53 as it is incomplete. Therefore, I am using the following Set Analysis:
Sum({<[OrderDate.autoCalendar.Week]={"<$(=Max([OrderDate.autoCalendar.Week]))"}>}Sales)
And this gives the following chart:
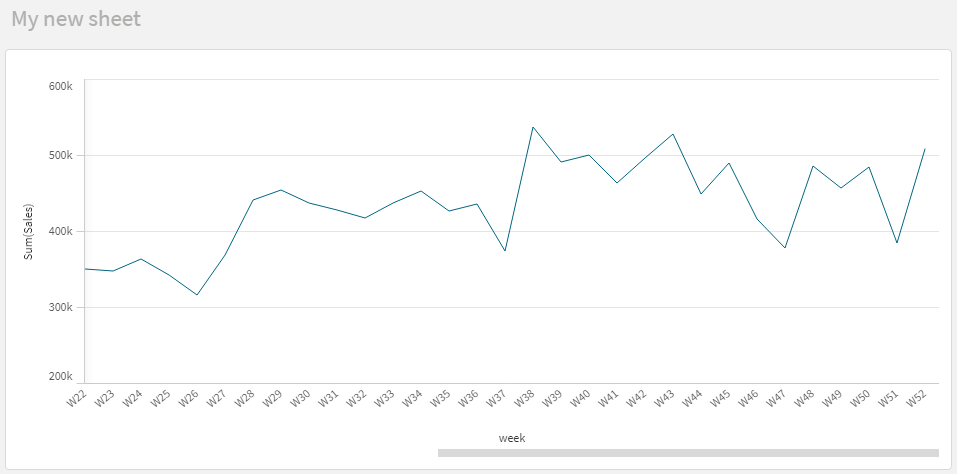
As you can see the last week is excluded.
I hope that this information was helpful. In case I have misunderstood the use case scenario, please elaborate in details by providing additional information. However, if it has helped you resolve the issue, please mark it as accepted solution to give further visibility to other community members.
- Mark as New
- Bookmark
- Subscribe
- Mute
- Subscribe to RSS Feed
- Permalink
- Report Inappropriate Content
You can use set analysis for your measure:
For example I have the following data:
As you can see we don't want the week 53 as it is incomplete. Therefore, I am using the following Set Analysis:
Sum({<[OrderDate.autoCalendar.Week]={"<$(=Max([OrderDate.autoCalendar.Week]))"}>}Sales)
And this gives the following chart:
As you can see the last week is excluded.
I hope that this information was helpful. In case I have misunderstood the use case scenario, please elaborate in details by providing additional information. However, if it has helped you resolve the issue, please mark it as accepted solution to give further visibility to other community members.