Unlock a world of possibilities! Login now and discover the exclusive benefits awaiting you.

- Qlik Community
- :
- Forums
- :
- Analytics & AI
- :
- Products & Topics
- :
- Visualization and Usability
- :
- Re: Highlight a Bar on a Stacked Bar Chart
- Subscribe to RSS Feed
- Mark Topic as New
- Mark Topic as Read
- Float this Topic for Current User
- Bookmark
- Subscribe
- Mute
- Printer Friendly Page

 Stars
Stars
- Mark as New
- Bookmark
- Subscribe
- Mute
- Subscribe to RSS Feed
- Permalink
- Report Inappropriate Content
Highlight a Bar on a Stacked Bar Chart
I am trying to highlight one bar in a stacked bar chart. In a simple bar chart, I can color by expression so whatever I have selected will be a single color and all other data will be a different color. But in a stacked bar, I need to leave the color alone so each piece in my stack has its own color. I would like my selected bar to be bold. I have attached two pictures - "Graph" is of the stacked bar graph and "Selected" shows what I would like it to look like when a bar is selected (I selected bar 31 for the example). I tried searching for this but didn't have any luck. And suggestions would be great. Thank you!
GRAPH: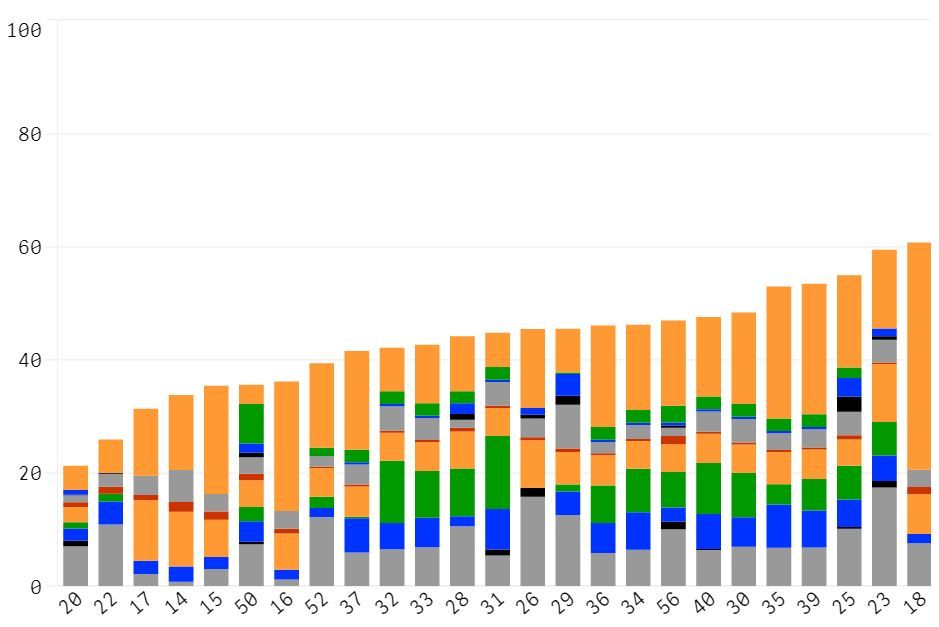
SELECTED:
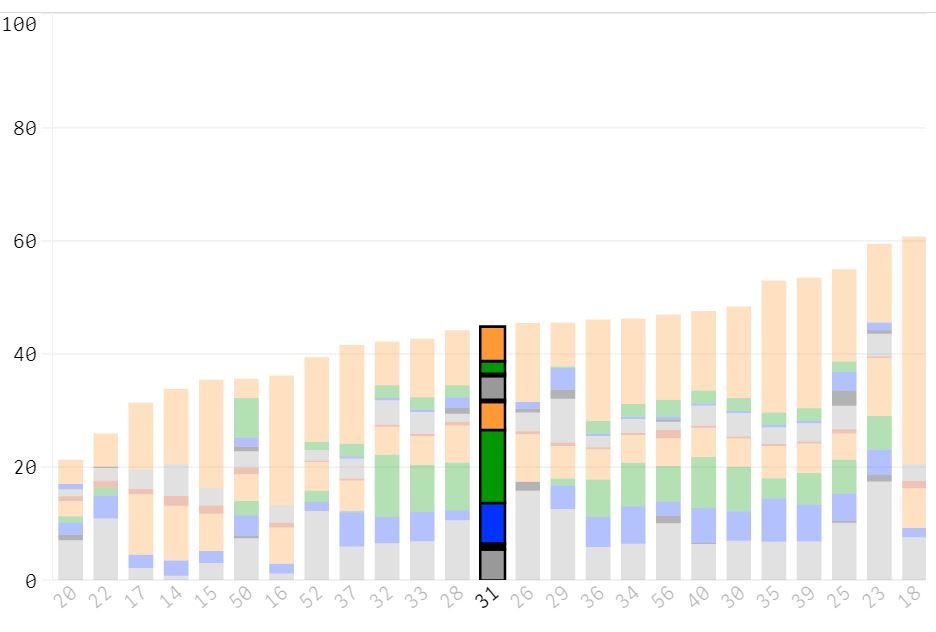


 sunny_talwar
- Mark as New
- Bookmark
- Subscribe
- Mute
- Subscribe to RSS Feed
- Permalink
- Report Inappropriate Content
Are you using color expression to display the colors?
Stars
- Mark as New
- Bookmark
- Subscribe
- Mute
- Subscribe to RSS Feed
- Permalink
- Report Inappropriate Content
I’m not using color by expression. When I tried that, all the pieces of my stack became the same color. Right now I set my color panel in IU panel in the JSON file in my theme. Each piece of my stack is a long equation, so I didn’t make them master measures or variables. I just added them and typed out the formula. In a simple bar chart, I can color by expression because the bars are all one color. But here I can’t figure out how without losing the pieces of my stacks!
Stars
- Mark as New
- Bookmark
- Subscribe
- Mute
- Subscribe to RSS Feed
- Permalink
- Report Inappropriate Content
I tried again. This time I made each piece of my stacked bar a master measure and specified a color. But when I try to color by expression so I can tell it to highlight one bar based on which company I select, it changes the bars so they're all single color again. Any tips?

 jonathandienst
- Mark as New
- Bookmark
- Subscribe
- Mute
- Subscribe to RSS Feed
- Permalink
- Report Inappropriate Content
Make sure that your colour by expression is overriding the selection - eg
Sum({<selection(s)_to_ignore, ...>} Amount)
where selection(s)_to_ignore is a comma separated list of field names to override.
Stars
- Mark as New
- Bookmark
- Subscribe
- Mute
- Subscribe to RSS Feed
- Permalink
- Report Inappropriate Content
Ooooh, can you explain that more? Every time I switch to color by expression, it makes all my bars single color (instead of multicolored stacks). Is there a way not to do that? I tried to figure out how to change the background color with argb instead of rgb, but it just made my stacked bars single color also.
jonathandienst
- Mark as New
- Bookmark
- Subscribe
- Mute
- Subscribe to RSS Feed
- Permalink
- Report Inappropriate Content
I don't have enough information to give you a definitive answer (data model, dimensions, expressions, etc). If things are not behaving when you make selections, you may need to override the problem selections using a set expression. In particular, you can override a field selection by using the <field= > syntax (the = sign is optional). There is a lot more information on set expressions and set analysis in the on line help, community blogs or the Qlik Youtube channels.
Stars
- Mark as New
- Bookmark
- Subscribe
- Mute
- Subscribe to RSS Feed
- Permalink
- Report Inappropriate Content
Hi - I created a newer (better) post with an attached qvf. The post title is: Opacity on a Stacked Bar Chart . Hopefully that gives you the information you need. I really appreciate you looking at this. Thank you!
