Unlock a world of possibilities! Login now and discover the exclusive benefits awaiting you.
- Qlik Community
- :
- Forums
- :
- Analytics & AI
- :
- Products & Topics
- :
- Visualization and Usability
- :
- How do I calculate MAPE in Qlik Sense?
- Subscribe to RSS Feed
- Mark Topic as New
- Mark Topic as Read
- Float this Topic for Current User
- Bookmark
- Subscribe
- Mute
- Printer Friendly Page
- Mark as New
- Bookmark
- Subscribe
- Mute
- Subscribe to RSS Feed
- Permalink
- Report Inappropriate Content
How do I calculate MAPE in Qlik Sense?
I'm not able to understand the mean part is it has to take the total no
- Tags:
- new to
- « Previous Replies
-
- 1
- 2
- Next Replies »
Accepted Solutions
- Mark as New
- Bookmark
- Subscribe
- Mute
- Subscribe to RSS Feed
- Permalink
- Report Inappropriate Content
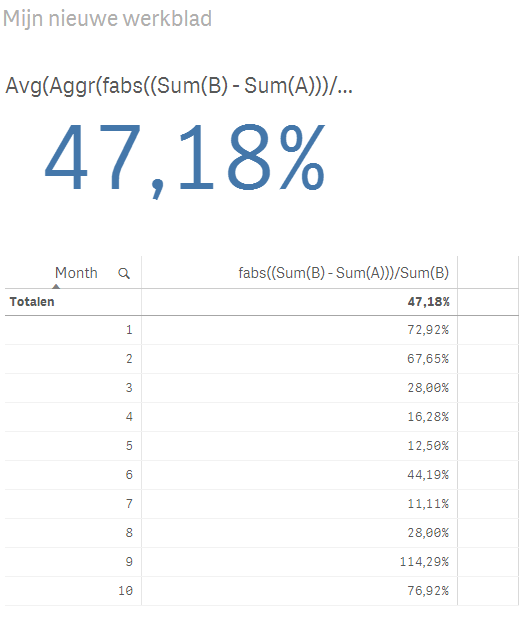
Can you try this:
Avg(Aggr(fabs((Sum(Sales) - Sum(Base_Forecast)))/Sum(Sales), Month))
- Mark as New
- Bookmark
- Subscribe
- Mute
- Subscribe to RSS Feed
- Permalink
- Report Inappropriate Content
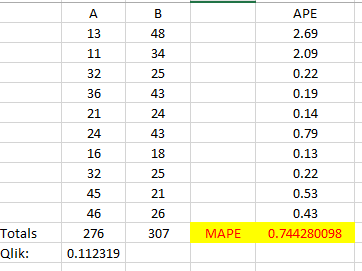
I need the MAPE calculated in yellow but Qlik is calculating differently it's summing the entire columns then subtracting. I want the it to be done differently. As given above.
- Mark as New
- Bookmark
- Subscribe
- Mute
- Subscribe to RSS Feed
- Permalink
- Report Inappropriate Content
Hi,
I've got no problems calculating your MAPE. Check the expression below.
Cheers,
Michiel

- Mark as New
- Bookmark
- Subscribe
- Mute
- Subscribe to RSS Feed
- Permalink
- Report Inappropriate Content
Hi Michiel,
I tried this way but it's not giving me the correct answer, in fact, it's giving me incorrect value for Difference b/w the forecast as well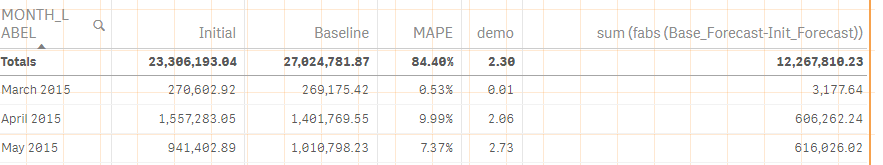
I tried using the formula
fabs((Sum(Init_Forecast) - Sum(Base_Forecast)))/Sum(Init_Forecast) which is giving me correct for each row but the only problem I'm facing is it's summing up an entire column of Initial and baseline forecast then applying the formula. What I want is it should apply the formula on each row as it is shown in the MAPE column then take the average of it. I've got the correct MAPE in the table but I don't know how to display it in a KPI.
- Mark as New
- Bookmark
- Subscribe
- Mute
- Subscribe to RSS Feed
- Permalink
- Report Inappropriate Content
Hi Shivan,
I'm sorry but I don't think I understand your question. In attached app I've added a month dimension to your Excel data (the data in your first message). No matter what kind of object I'm using the MAPE keeps rolling up to 74%. Just like you highlighted in your first message.
If the enclosed app doesn't help, could you please share yours or show the expressions you use?
Cheers,
Michiel
- Mark as New
- Bookmark
- Subscribe
- Mute
- Subscribe to RSS Feed
- Permalink
- Report Inappropriate Content
Hi Michiel,
I'll explain you in full.I've made changes in your qvf. Please see that. The 74% you're getting is maybe because of the totals column may be set to auto.
- Mark as New
- Bookmark
- Subscribe
- Mute
- Subscribe to RSS Feed
- Permalink
- Report Inappropriate Content
I need to calculate MAPE and for that I am using the formula:
"fabs((Sum(Sales) - Sum(Base_Forecast)))/Sum(Sales)".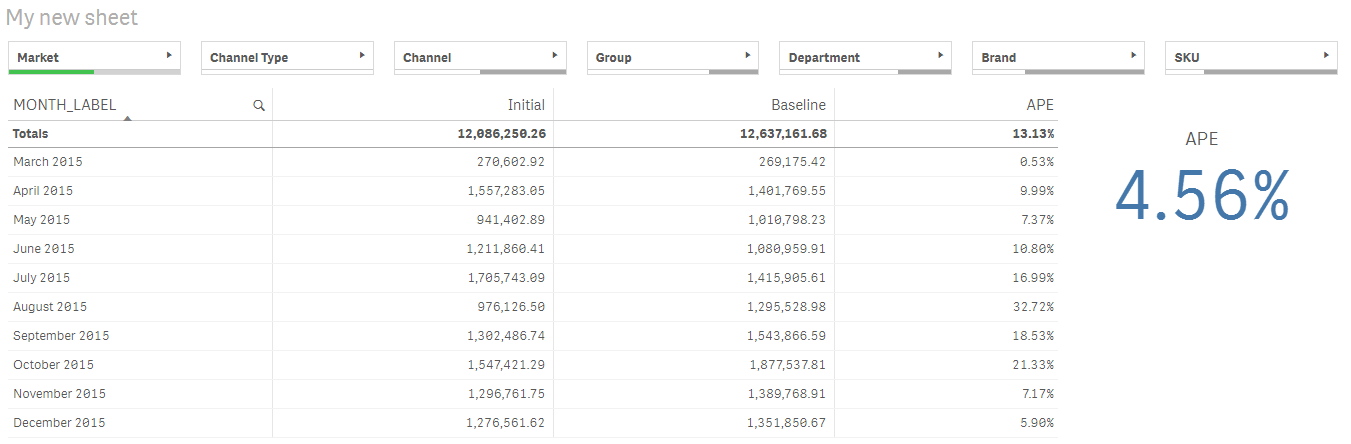
This is giving me correct Absolulte%Error which is shown in the above figure under ape column. If I change the totals column to average I get MAPE. Which is what I want but when I use this formula in a KPI it's applying this formula on the Total's of Initial & Baseline instead of applying on each row then take an average. Is there any way I can refer that table value or how can I get that calculated value in the KPI.
Any help would be greatly appreciated  and please let me know If what I'm doing is wrong.
Thanks
- Mark as New
- Bookmark
- Subscribe
- Mute
- Subscribe to RSS Feed
- Permalink
- Report Inappropriate Content
Can you try this:
Avg(Aggr(fabs((Sum(Sales) - Sum(Base_Forecast)))/Sum(Sales), Month))
- Mark as New
- Bookmark
- Subscribe
- Mute
- Subscribe to RSS Feed
- Permalink
- Report Inappropriate Content
Hi Sunny, This works absolutely fine. This will help me for now, but this is static now according to month how can I make this dynamic if want to change the dimension to maybe year or quarter?
- Mark as New
- Bookmark
- Subscribe
- Mute
- Subscribe to RSS Feed
- Permalink
- Report Inappropriate Content
This has to be based on a selection, right? Where are you planning to make the selection in Year, Month or Quarter Field?
- « Previous Replies
-
- 1
- 2
- Next Replies »