Unlock a world of possibilities! Login now and discover the exclusive benefits awaiting you.
- Qlik Community
- :
- Forums
- :
- Analytics & AI
- :
- Products & Topics
- :
- Visualization and Usability
- :
- How do I show a total line in a line chart?
- Subscribe to RSS Feed
- Mark Topic as New
- Mark Topic as Read
- Float this Topic for Current User
- Bookmark
- Subscribe
- Mute
- Printer Friendly Page
- Mark as New
- Bookmark
- Subscribe
- Mute
- Subscribe to RSS Feed
- Permalink
- Report Inappropriate Content
How do I show a total line in a line chart?
It seems this should be a trivial task, but I haven't found a way to do this in Qlik Sense.
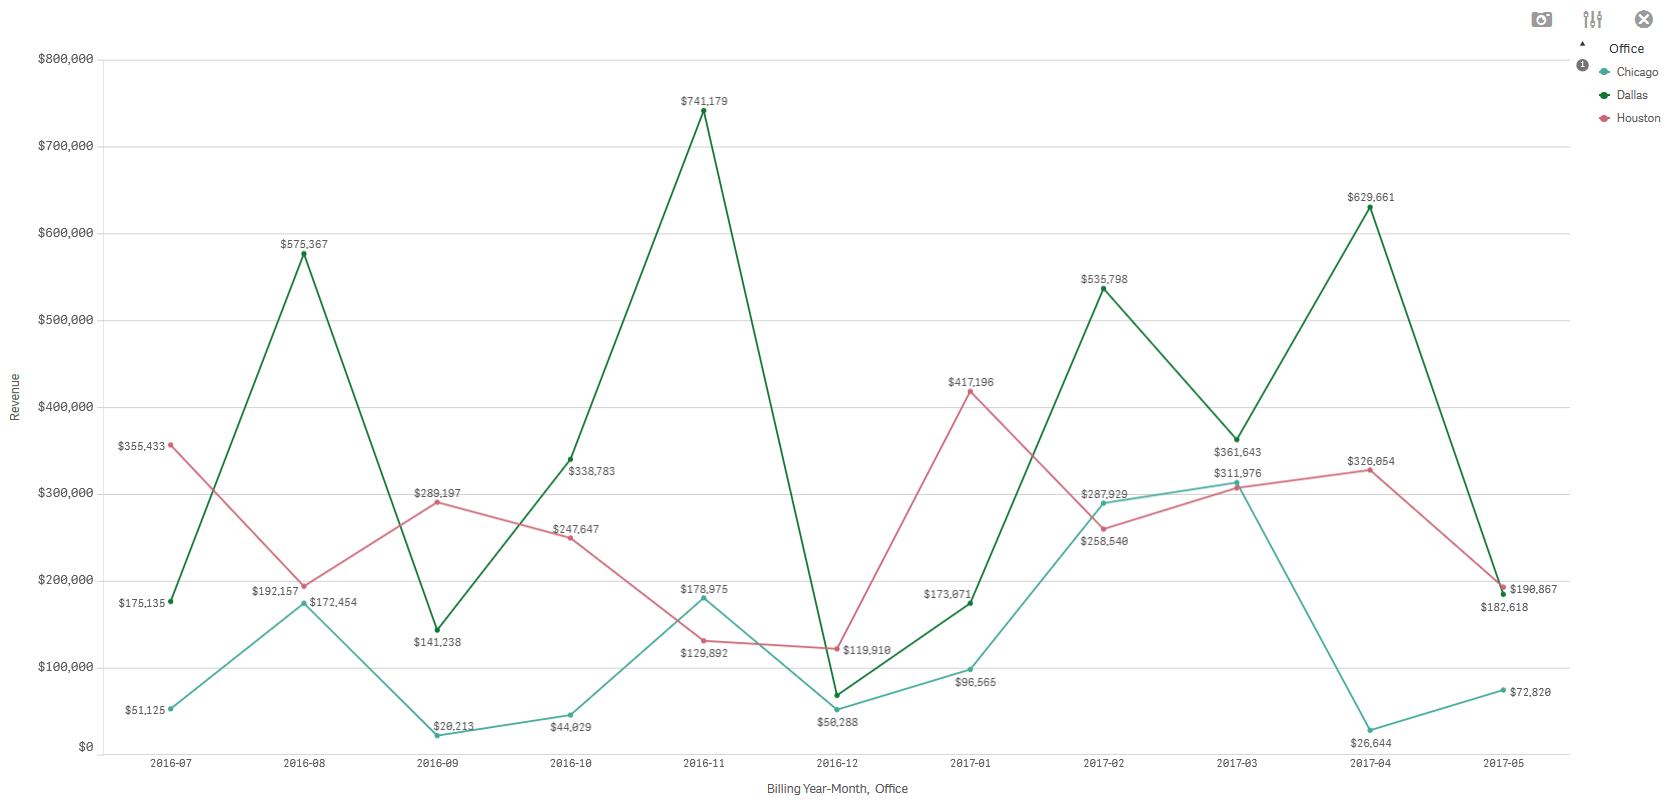
Given a two-dimensional line chart that shows revenue by office per month as shown in the screenshot below (and in attachment), is there a way to display not only one revenue line for each office but also a total (or average) revenue line for all displayed offices?

In the above example, I would like to see a 4th line that represents, for each month, the total (or the average) of the revenue for all 3 offices (Chicago, Dallas, Houston). Furthermore, if the user filters on offices to show only Chicago and Dallas, than I would want the total line not to include Houston revenue.
I tried using the Reference Line add-on, but I was not able to make it show a total (or average) for each office, varying from month to month.
Thanks in advance to anyone who can help me with this seemingly simple (but elusive in Sense) requirement.
Accepted Solutions
- Mark as New
- Bookmark
- Subscribe
- Mute
- Subscribe to RSS Feed
- Permalink
- Report Inappropriate Content
Hi Ken,
Yes you can do this.
Assuming you have a table of [Offices] as :
Office_Code_Key / Office_Name / Office_Group
1 / Chicago / Blabla
2 / Dallas / Etc. Etc.
3 / Houston / AnotherGroup
You actual script to load this is :
Offices:
LOAD
Office_Code_Key,
Office_Name,
Office_Group
From Offices_Sources;
You will have to change for this :
Offices:
LOAD
Office_Code_Key,
Office_Name,
Office_Name as Line_Chart_Special_Office_Name,
Office_Group
From Offices_Sources;
// if you want a line for total
concatenate(Offices)
LOAD
Office_Code_Key,
'Total' as Line_Chart_Special_Office_Name
From Offices_Sources;
// if you want a line for average
concatenate(Offices)
LOAD
Office_Code_Key,
'Average' as Line_Chart_Special_Office_Name
From Offices_Sources;
That way, every office will be linked to the 'Total' or 'average' Special_Office_Name
Then, in your line chart :
Dimensions:
Months and Line_Chart_Special_Office_Name
Measure :
if(
Line_Chart_Special_Office_Name='Average',
sum(MeasureFieldYouUse)/count(distinct Office_Name), // only for average, it would be the total divided by offices
sum(MeasureFieldYouUse) // both for normal lines and the total lines because ine the script every office will be linked to total
)
BR,
Thomas Le Gall
- Mark as New
- Bookmark
- Subscribe
- Mute
- Subscribe to RSS Feed
- Permalink
- Report Inappropriate Content
in expression add
= colume1+ colume2 + colume3
- Mark as New
- Bookmark
- Subscribe
- Mute
- Subscribe to RSS Feed
- Permalink
- Report Inappropriate Content
Hi Ken,
Yes you can do this.
Assuming you have a table of [Offices] as :
Office_Code_Key / Office_Name / Office_Group
1 / Chicago / Blabla
2 / Dallas / Etc. Etc.
3 / Houston / AnotherGroup
You actual script to load this is :
Offices:
LOAD
Office_Code_Key,
Office_Name,
Office_Group
From Offices_Sources;
You will have to change for this :
Offices:
LOAD
Office_Code_Key,
Office_Name,
Office_Name as Line_Chart_Special_Office_Name,
Office_Group
From Offices_Sources;
// if you want a line for total
concatenate(Offices)
LOAD
Office_Code_Key,
'Total' as Line_Chart_Special_Office_Name
From Offices_Sources;
// if you want a line for average
concatenate(Offices)
LOAD
Office_Code_Key,
'Average' as Line_Chart_Special_Office_Name
From Offices_Sources;
That way, every office will be linked to the 'Total' or 'average' Special_Office_Name
Then, in your line chart :
Dimensions:
Months and Line_Chart_Special_Office_Name
Measure :
if(
Line_Chart_Special_Office_Name='Average',
sum(MeasureFieldYouUse)/count(distinct Office_Name), // only for average, it would be the total divided by offices
sum(MeasureFieldYouUse) // both for normal lines and the total lines because ine the script every office will be linked to total
)
BR,
Thomas Le Gall
- Mark as New
- Bookmark
- Subscribe
- Mute
- Subscribe to RSS Feed
- Permalink
- Report Inappropriate Content
I agree with Thomas
I use this method also for any other additional grouping in chart/table - I find it very easy to implement and efficient!
cheers
Lech
- Mark as New
- Bookmark
- Subscribe
- Mute
- Subscribe to RSS Feed
- Permalink
- Report Inappropriate Content
Thanks, Thomas. I had actually done some more searching and found a similar solution (Net Total line in Qlik Sense line chart), but I appreciate that you spelled it out so clearly for me and that you included the Average option.